
SMAP Soil Moisture Mapper begins Science Data Collection
Originally published May 20, 2015
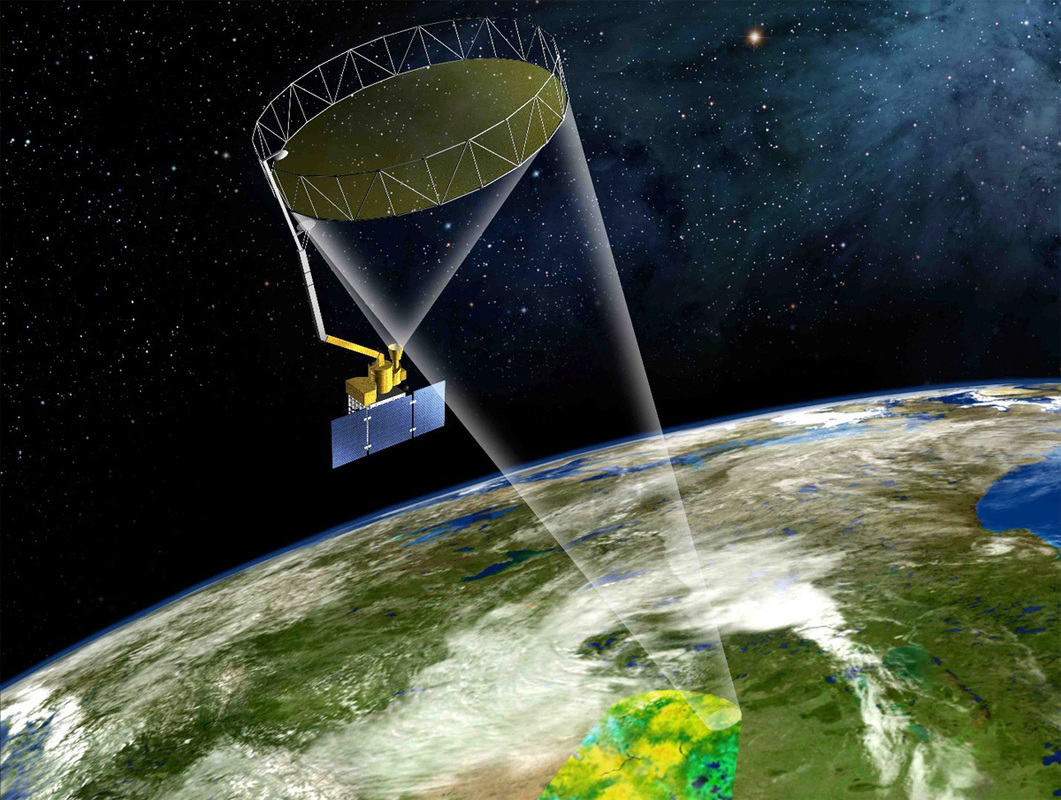
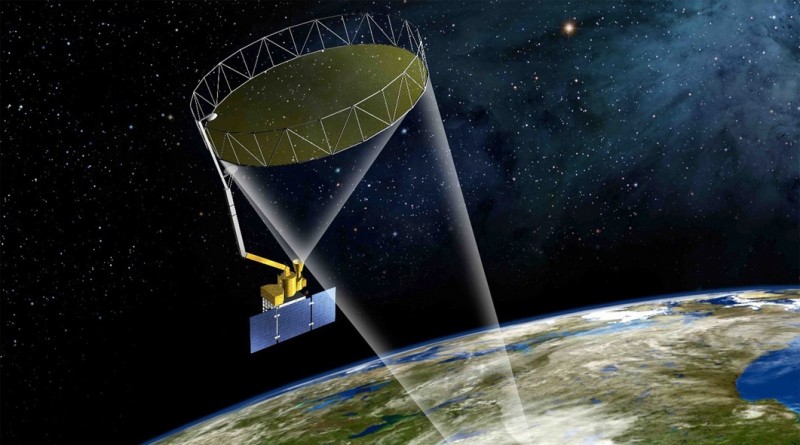
NASA’s Soil Moisture Active/Passive (SMAP) Mission has begun science operations after successfully concluding a three-month commissioning phase during which the spacecraft deployed and spun-up a large antenna reflector feeding a scientific payload consisting of a passive radiometer and active radar to keep tabs on global soil moisture and freeze/thaw state to provide additional data needed in the study of Earth’s water cycle and climate change and for operational applications such as the prediction of adverse conditions such as landslides and droughts.
Launched on January 31 atop a Delta II rocket, the 944-Kilogram spacecraft entered an orbit of 683 Kilometers from where it can cover a 1,000-Kilometer footprint by rotating its large antenna reflector that first had to complete its deployment in a two-step process in mid February, enabling the spacecraft to send back its first light data in late February after the radar and radiometer were activated, first without rotation on the reflector.
Spin-up was completed in stages to keep the spacecraft safe, starting with an initial rotation on March 23 before the spin was increased to 14.6 RPM that enables SMAP to sweep out a full circle with sufficient overlap between individual scans to cover a 1,000km footprint which in turn allows the spacecraft to cover the entire surface of Earth every two to three days.
With the reflector spinning at the planned rate and the satellite in precise Earth-pointing mode, the way was clear for a first operational test that ran from March 31 to April 3 to put the spacecraft, its instruments and the ground-based data processing system through a typical science operations cycle.
The first global map produced by the SMAP spacecraft was used to verify the pointing accuracy of the antenna and the overall performance of the two instruments. The first global map delivered by SMAP reached a spatial resolution of 30 Kilometers.
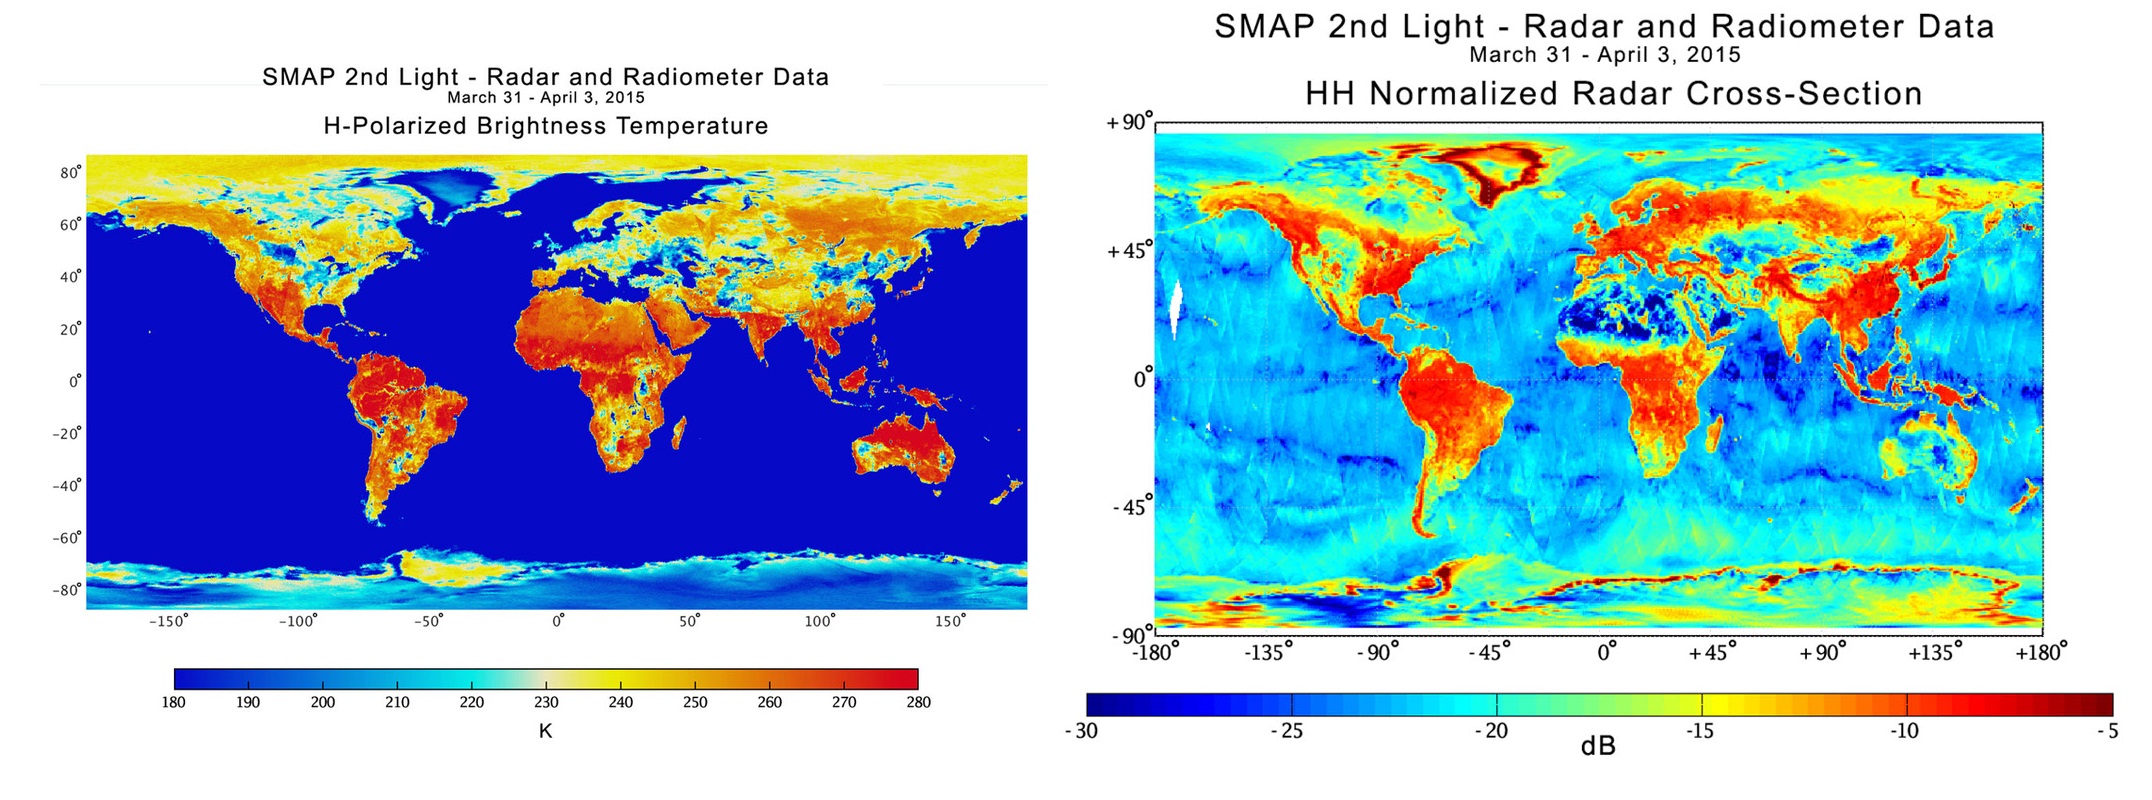
The global map shows global land, ocean and ice conditions. Standing out are dry areas such as the Sahara and Gobi deserts that appear in blue tones in the radar map on the right side, reflecting their low soil moisture content and lack of vegetation. The rain forests on the Amazon and the Congo show very strong signals given their dense vegetation and surface water content. In North America, the differences in soil moisture can be very well seen between the Sierra Nevada and Cascade mountain ranges and areas east of the Mississippi river that show stronger radar echoes in contrast to the Great Plains of the United States. Variations picked up over the open ocean correspond to differences in surface winds which can also be tracked by SMAP and the instruments also allow a differentiation between water and sea ice.
The global map showing the radiometer data (left) depicts the brightness temperatures measured by the instrument – red colors corresponding to hot and dry areas and blue shades corresponding to areas with abundant vegetation and soil moisture as well as the ocean and ice.
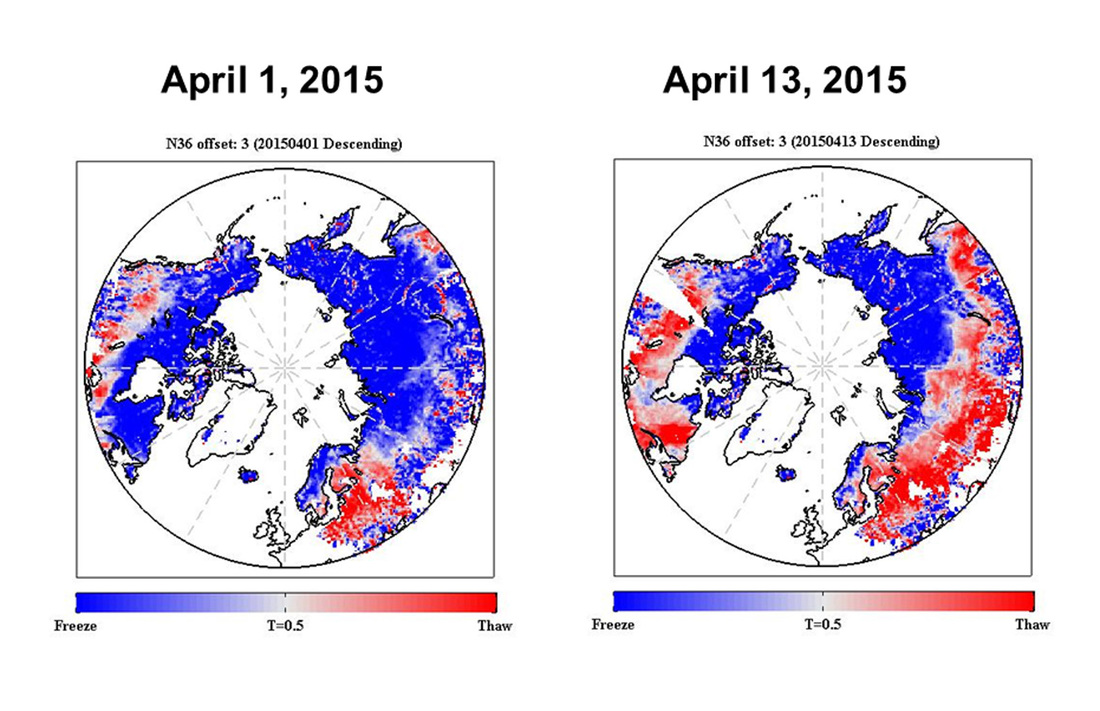
April provided a good opportunity to SMAP to track the onset of spring by measuring soil freeze/thaw states with a radar image resolution of up to three Kilometers. The maps generated from the data show frozen areas in blue and thawed soil moisture in red. Over the course of the month, a thaw front can be seen moving from predominantly southern latitudes to the still-frozen north. Tracking the progression of the spring transition is of importance to scientists since the onset of spring brings with it the initiation of activity in forests which has implications for Earth’s carbon cycle.
The onset of spring thaw can be considered the beginning of activity by carbon sinks in the form of vegetation taking up carbon dioxide from the atmosphere. When winter arrives, these sinks come to a stop and tracking the length of the growth season can provide insight into the net carbon budget of certain areas or certain types of vegetation.
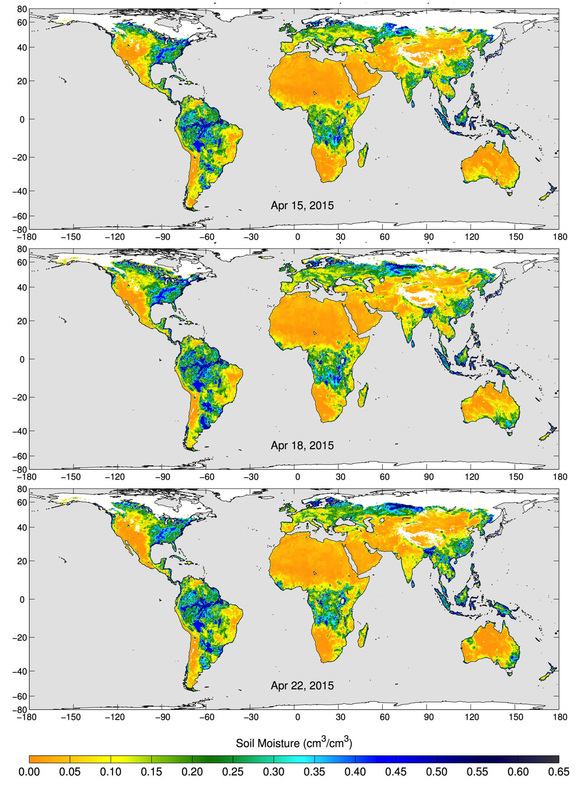
Data gathered in April was already processed into spatial patterns of melt transition and the timing of periodic frost events is being studied in association with data from surface-based measurement stations to better understand the response to the radar signals to changes in the soil to fine-tune the data processing algorithms to get the most out of the data delivered by SMAP. Radiometer data gathered in April (seen above) was processed to global soil moisture maps showing areas that are dry in orange and yellow while moist soil shows up in blue. White corresponds to ice, snow or frozen ground.
By May, SMAP officially headed into the Science Phase of the mission, marking the completion of spacecraft and instrument commissioning with a clean spacecraft and a perfectly functioning instrument payload. The work to calibrate the instruments is far from over, though. It will take another year to properly calibrate the radar and radiometer payloads to achieve the best possible measurement accuracy that can be achieved by SMAP to deliver unprecedented maps of global soil moisture. SMAP is expected to operate for at least three years of data acquisition in a mission that could be extended if the performance of the vehicle permits it.
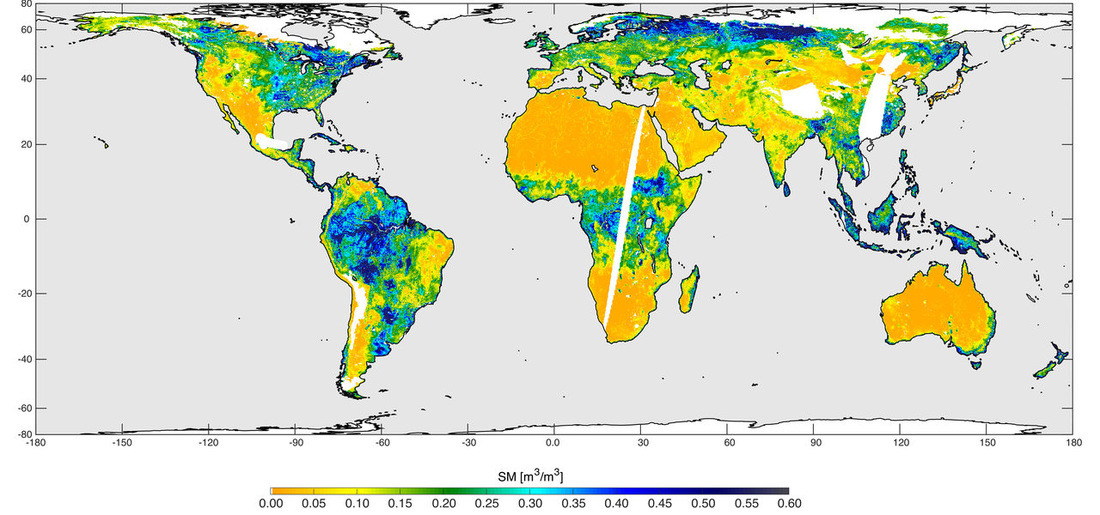
Declaring SMAP ready for science operations, NASA provided a new global map acquired by SMAP between May 4 and 11 at a resolution of nine Kilometers, demonstrating the capabilities of the instrument in terms of spatial resolution that will allow scientists to monitor regional phenomena and use data in operational weather forecasting.
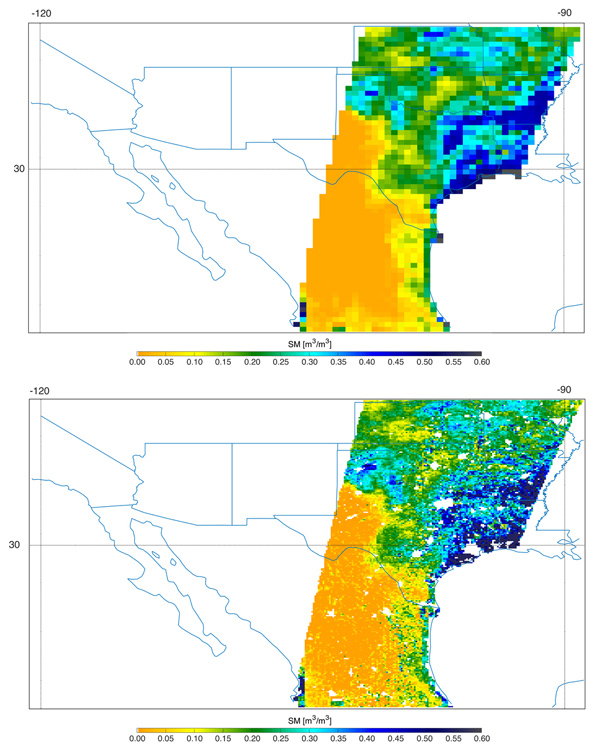
The global map shows dry conditions across the world’s deserts as well as Central Australia and the Midwest US. Moist soil can be seen in Europe, South America and Asia. In a second data product, NASA released a radar image of southern U.S. in the upper half and a combined active-passive data product below. While the radar by itself can accurately determine soil moisture content, its spatial resolution is not as high, requiring its data to be combined with the radiometer data that is less sensitive in the measurement of soil moisture but capable of delivering data at a high spatial resolution.
“Fourteen years after the concept for a NASA mission to map global soil moisture was first proposed, SMAP now has formally transitioned to routine science operations,” said Kent Kellogg, SMAP project manager at JPL. “SMAP’s science team can now begin the important task of calibrating the observatory’s science data products to ensure SMAP is meeting its requirements for measurement accuracy.”
Preliminary calibrated data from SMAP will start to be published in August followed by freeze/thaw products in November and validated measurements after calibration in 2016.
The SMAP mission – Soil Moisture Active/Passive – aims to deliver the most accurate, highest-resolution global soil moisture measurements at a two-to-three-day repeat cycle – detecting the amount of water in the ground and whether it is frozen or thawed.
These measurements are possible through the use of a passive radiometer instrument that records Earth’s natural microwave emissions at wavelengths characteristic for water and an active radar payload that sends radar pulses to the ground and records the reflected echo. The mission makes use of the advantages of the two different instruments, namely the accuracy of radiometer measurements and the resolution of radar readings that are combined to generate accurate high-resolution moisture maps that will surpass all current measurement methods.
>>>Detailed Spacecraft, Instrument & Science Overview
Soil moisture is critical for plant growth and plays a major role in Earth’s energy cycle since evaporation cools the land surface and lower atmosphere while seeding the upper atmosphere with moisture causing clouds and rain. High-resolution moisture maps provided at a high temporal resolution can allow scientists to understand how regional water availability changes over time which can help in water resource management and the forecasting of floods, droughts and landslides.