
Instrument Overview
SMAP Instrument
The 356-Kilogram instrument of the SMAP spacecraft shares its name with the spacecraft itself and, as the name states, consists of an active part, an L-Band radar that sends radio pulses to the ground and records the echo, and a passive part, an L-Band radiometer that just records the ambient microwave emissions at the given wavelength range. Water, including water within the soil, responds differently to microwave radiation than dry soil. The water content influences the strength of the backscatter and the polarization of the radiation. Backscatter from soil with a high water content is stronger and has a different polarization than dry soil which can be detected by the instrument package.
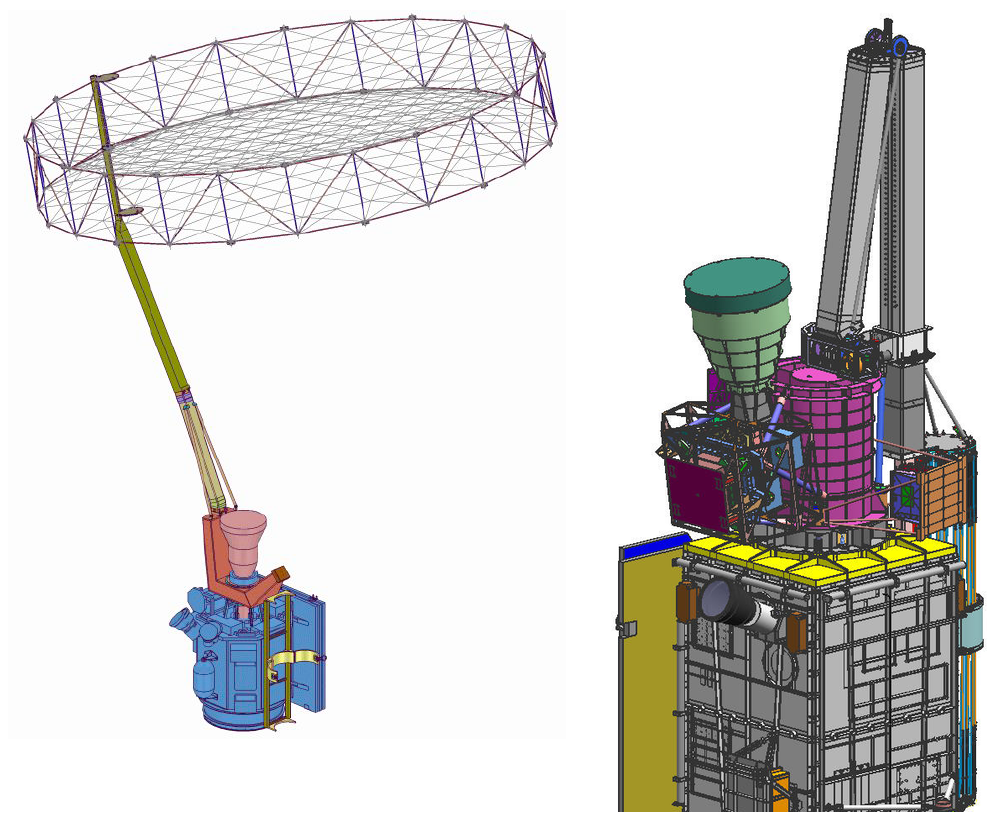
As with most microwave instruments, the antenna is the most prominent feature of the instrument – in SMAP’s case it is a 6-meter rotating mesh antenna that has been one of the greatest challenges in the development of the spacecraft.
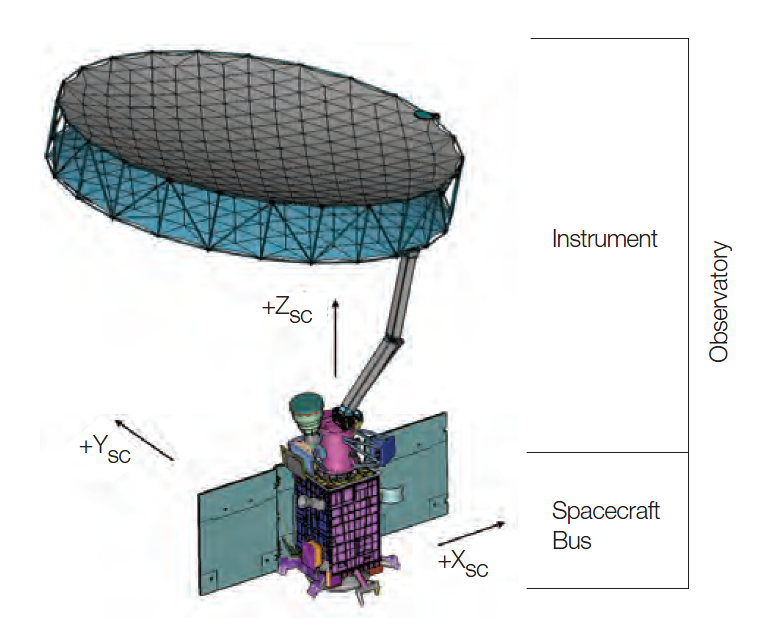
The SMAP instrument consists of a rotating and a non-spun structure. The rotating part is comprised of an antenna boom, the deployable mesh antenna, the rotation mechanism and a series of front-end electronics.
The spinning instrument components reside on the zenith deck of the spacecraft to reduce overall spun mass/inertia, reduce radio frequency transmission line losses and lower the noise temperature for radiometer measurements.
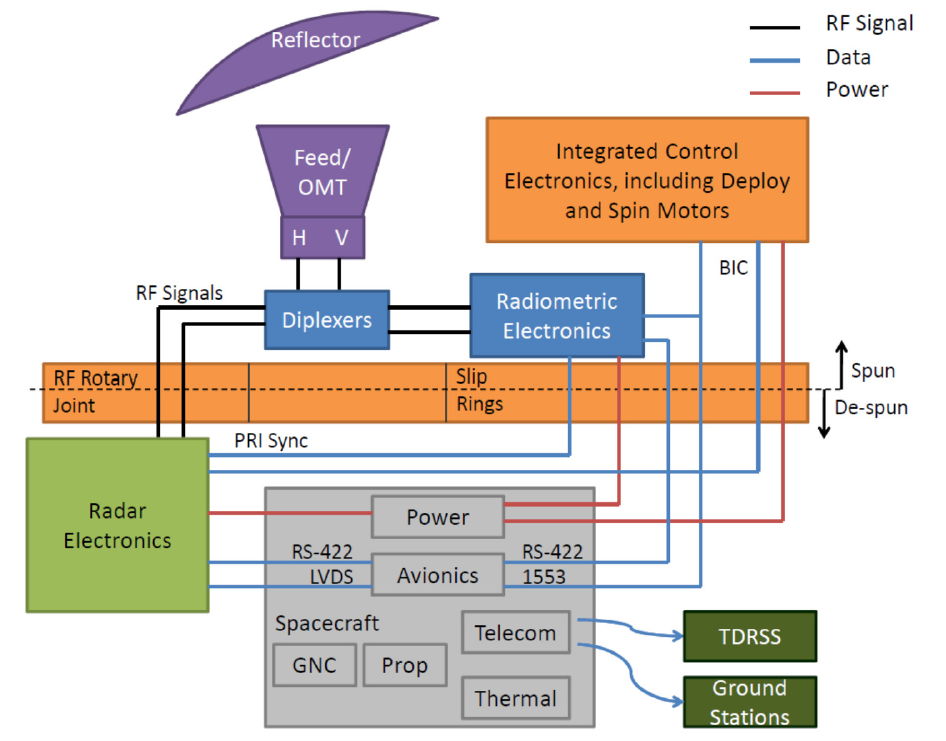
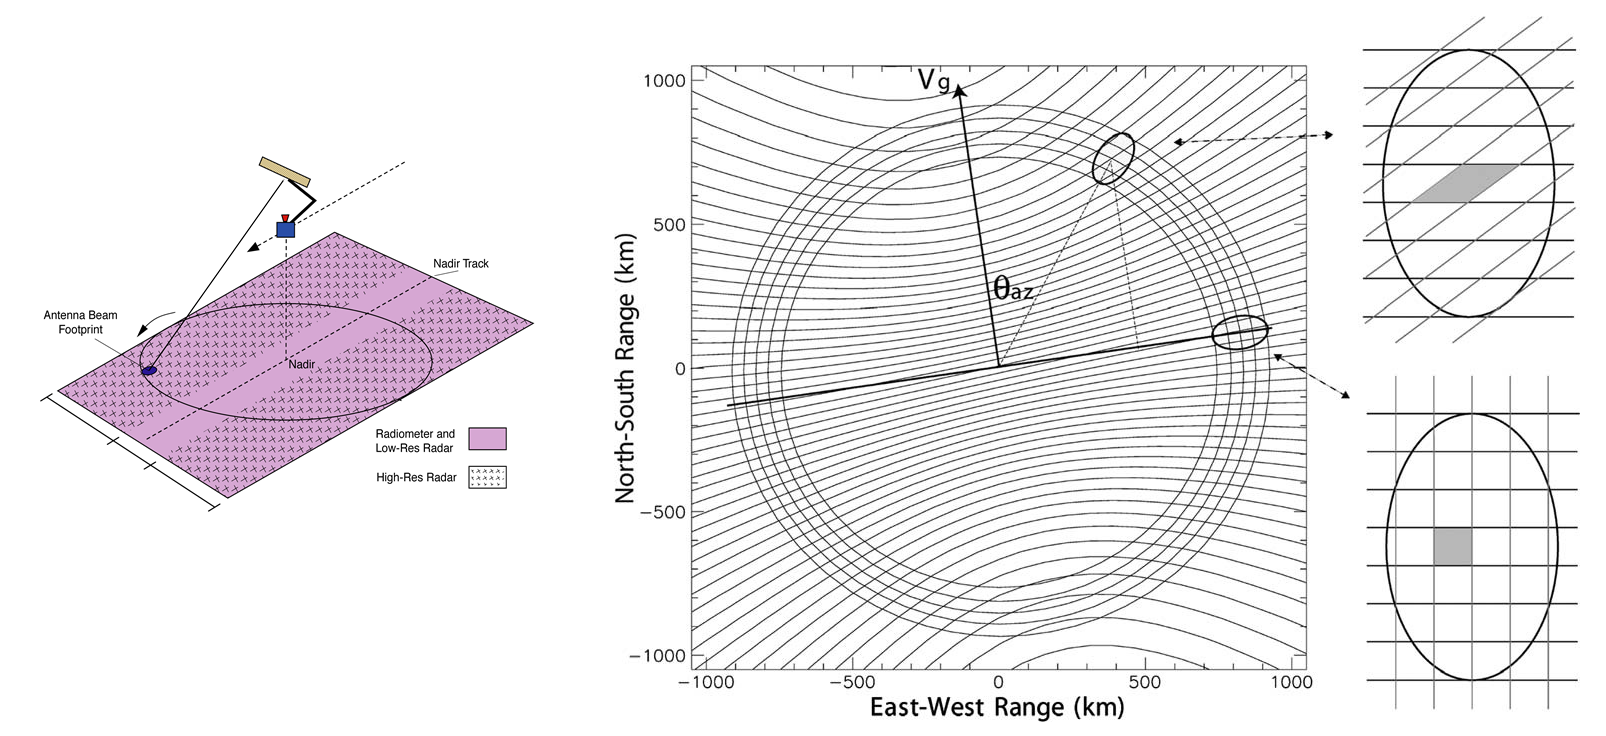
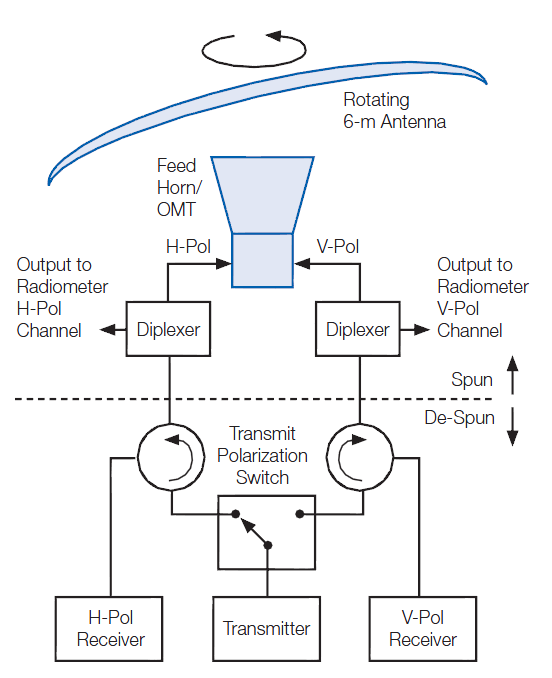
The passive radiometer operates in a dual polarization mode covering linear horizontal and linear vertical polarized signals while the radar instrument can operate in HH (pulse-receive), VV and HV polarization. One of the major objectives of SMAP was a rapid revisit time in the range of two to three days, requiring a wide ground swath of 1,000 Kilometers to be covered by the instrument. Furthermore, the chosen L-Band frequency and desired spatial resolution dictated the size of the antenna aperture. Radiometer and radar share the same antenna and feed horn accomplishing the simultaneous radar and radiometer requirements – implementing diplexers to separate the active from the passive bands that use different frequency ranges. All of the radiometer electronics reside on the spun side of the rotating Reflector Boom Assembly (RBA) while the radar electronics are hosted on the satellite platform because of thermal requirements.
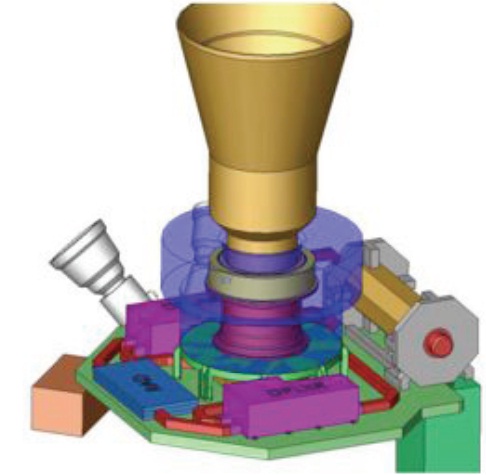
The spun-side of the SMAP instrument features the single feedhorn, the diplexers, the Deployment and Spin Motor Control Unit, and the Radiometer Electronics. The Spun Platform Assembly includes the primary and secondary structures. The former provides the backbone of the instrument, being the installation platform for the antenna boom while the secondary structure facilitates the shared feedhorn of the instrument and the Integrated Feed Assembly electronics box.
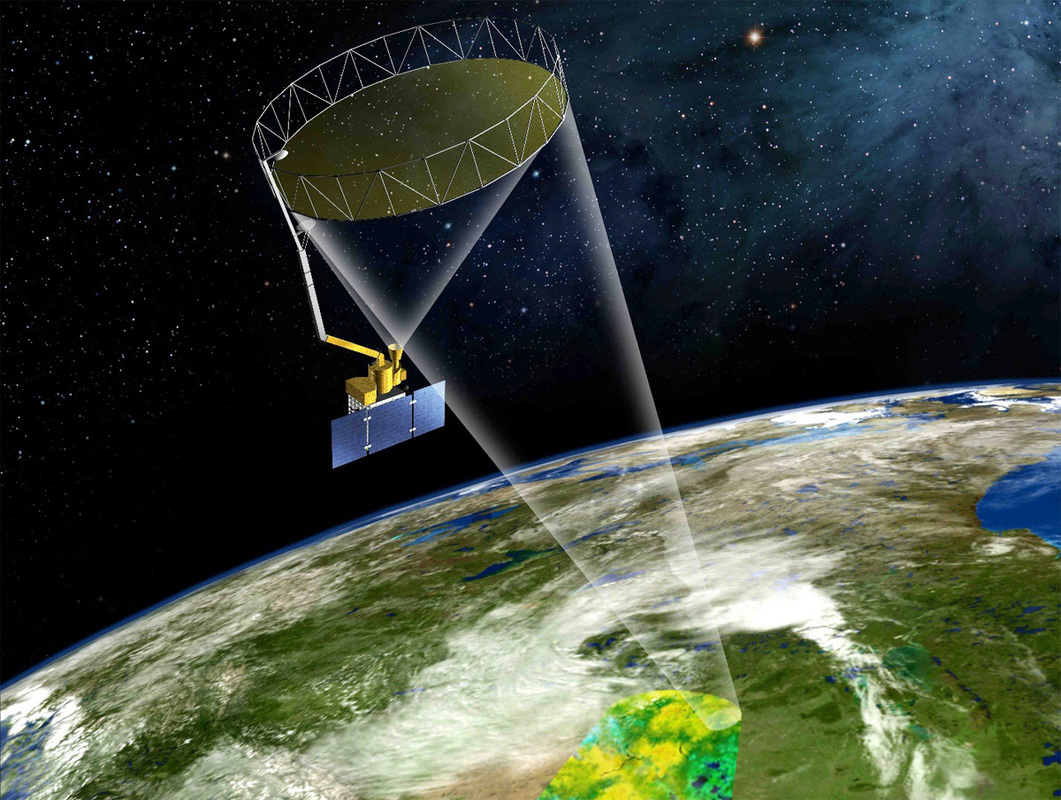
SMAP employs a conical-scanning geometry with a spinning antenna reflector rotating 14.6 times per minute around the nadir-pointing axis of the spacecraft. The rotation frequency was chosen to achieve the desired field of view with minimal overlap in between sans in the along-track direction. The RBA has a mass of 65 Kilograms including its launch restraint that holds the boom in a fixed position with the stowed antenna held to the spacecraft side. The spinning portion of RBA weighs 49 Kilograms.
The core of the spin subsystem is a Bearing and Power Transfer Assembly that includes the spin motor with associated bearings, an RF rotary joint of the radar, and 65 slip rings forming the electrical and data connection between the spun and not-spun side of the SMAP instrument. In addition to the physical power and data interfaces through the slip rings, both sides of the interface also include radio equipment for data transfer.
The physical interfaces are power supplies to the Radiometer Electronics and the Deployment and Spin Motor Controllers, and data interfaces with the instrument electronics and spacecraft Command & Data Handling Systems. Radio interfaces are used between the Radiometer and Radar electronics and the instrument electronics unit that reside on the non-spun side.
The Bearing and Power Transfer Assembly resides within the cylindrical section of the instrument that also serves as mounting structure for all spun-side equipment. All spun-side motors, thermal control equipment, command and telemetry systems are controlled from the Integrated Control Electronics. The Front End Electronics, passive RF components, the feed horn are installed on separate structures from the Spin Control Electronics to optimize the spun mass properties. A Cone Clutch Assembly builds the interface between the spun platform assembly and the spacecraft bus.
All the spinning elements are referred to as Spun Instrument Assembly SIA. The Spun Instrument Assembly is balanced by offsetting the feed and spin electronics assemblies from the spin axis and adding small balance masses in key locations.
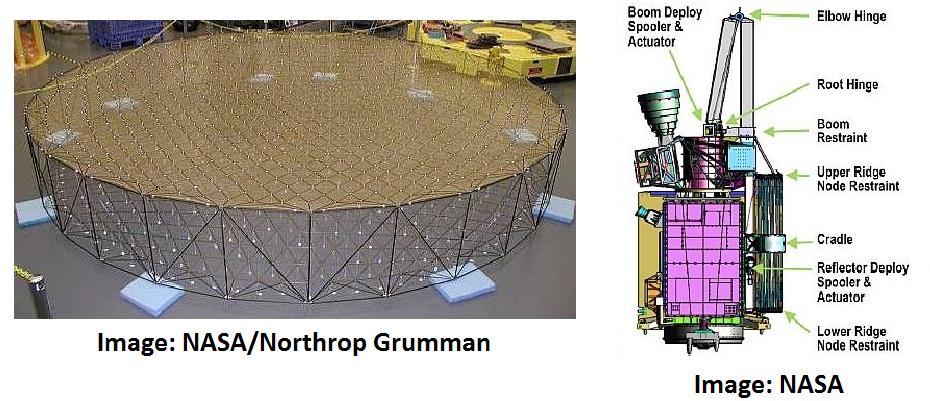
The Reflector Boom Assembly consists of a Boom Deploy Spooler and Actuator, a lower boom segment, an elbow hinge, an upper boom segment, a boom restraint and the Reflector itself with its own Deploy Spooler & Actuator. The 5-meter long boom itself consists of two graphite-epoxy tubes to form a lightweight and stable system. Deployment of the boom is completed in a 16-minute sequence as launch locks are opened by pyrotechnics and spoolers and actuators wind a cable that pulls the two-hinged boom to its fully extended position.
Boom deployment is followed four days later by the 33-minute deployment of the antenna reflector using its own spooler and actuator. During the deployment, the spacecraft attitude control system is placed in idle mode.
The reflector used by SMAP was provided by Northrop Grumman marking the first time the deployable Astromesh reflector is used in a scientific instrument deployed into a Low Earth Orbit, and the first time it is used with a microwave radar and radiometer instrument. Normally, the Astromesh reflector is used on communications satellite acting as antenna reflector.
The reflector consists of a perimeter tube featuring composite tubes that support front and rear webs of fiber-reinforced tape. The reflective surface consists of a gold-plated molybdenum wire mesh that is secured by a net connected to a front web to ensure the reflective surface remains in a parabolic shape. Interfacing with the boom is a prime batten that is mated to the perimeter truss segment which can fould out like a camping chair to enter a relatively stable configuration while being of a low-mass design.
The mesh uses a 20 OPI Structure (Openings per inch) that was chosen based on a compromise between mass and emissivity, meeting the L-Band emissivity requirements. For proper soil moisture measurements, the antenna reflector went through a calibration campaign to allow temperature estimations once in orbit in order to perform antenna pattern correction during data processing.
Using an Offset-fed deployable parabolic reflector design, the SMAP instrument achieves a focal length of 4.2 meters operating at a beamwidth of 2.7° for the radar and 2.5° for the radiometer. The antenna is pointed 35.5 degrees off the spin axis creating a 40-degree incidence angle. Due to the large size of the instrument field of view, the cone swept out by the antenna is slightly obstructed by the upper corners of the two outer solar panels. Analysis showed that the resulting performance perturbations are negligible.
Because of the antenna design, tests of actual flight hardware on the ground were not possible with the exception of tests of exact scale models and software-based analysis to determine relevant parameters such as gain, half-power beamwidth, sidelobe and cross-polarization levels, and electrical pointing.
Spin-up of the antenna is accomplished in two stages due to limitations imposed by the attitude control system that will have to counter the torque introduced into the spacecraft bus which would start rotating into the opposite direction from SIA. Momentum will be compensated by the reaction wheels as SIA spins up to 5 RPM. After desaturating the wheels, SIA can continue the spin-up to reach the proper 13 to 14.6 RPM rotation speed.
The 30-Kilogram radiometer measures microwave emissions for horizontal and vertical polarization in order to determine brightness temperatures. It includes digital electronics and spectral filtering for radio frequency interference mitigation. It is approximately 0.9 by 0.8 meters in size. Radiometers are required to make repeatable measurements with monotonic responses over the operational temperature range & over the course of an extended period of time. SMAP’s radiometer is equipped with a titanium thermal isolator and Expanded Polystyrene radome for short-term temperature stability and an active thermal control system with set-point adjustment to be able to control the temperature of the instrument over the long term. With an active system, the instrument temperature can be changed in orbit which will allow for the correction of gain non-linearities.
The single feedhorn of the SMAP instrument is shared between the radar and radiometer instruments, interfacing with a diplexer that separates the passive and active bands through high RF frequency isolation and pre-select filtering for interference rejection. The diplexer assembly also includes the high-power electronics for the radar.
The L-Band Radiometer operates at a frequency range of 1,400 to 1,427 MHz delivering data in vertical and horizontal polarization and the 3rd & 4th Stokes Parameters. The system operates at a thermal accuracy of 1.3K and a ground resolution of 10 Kilometers, using a sample frequency of 3.2kHz.
The nominal data rate for the radiometer is 4.3Mbit/s. Calibration of the radiometer is accomplished by making regular observation of stable Earth and space targets as well as internal calibration targets. Horizontal and vertical linear polarizations are selected through an Orthomode Transducer.
Front end electronics used by the Radiometer include a calibrated noise source. The front and back end electronics form a heterodyne radiometer that completes a downconversion of predetected horizontal and vertical polarization component signals to a 120MHz intermediate frequency.
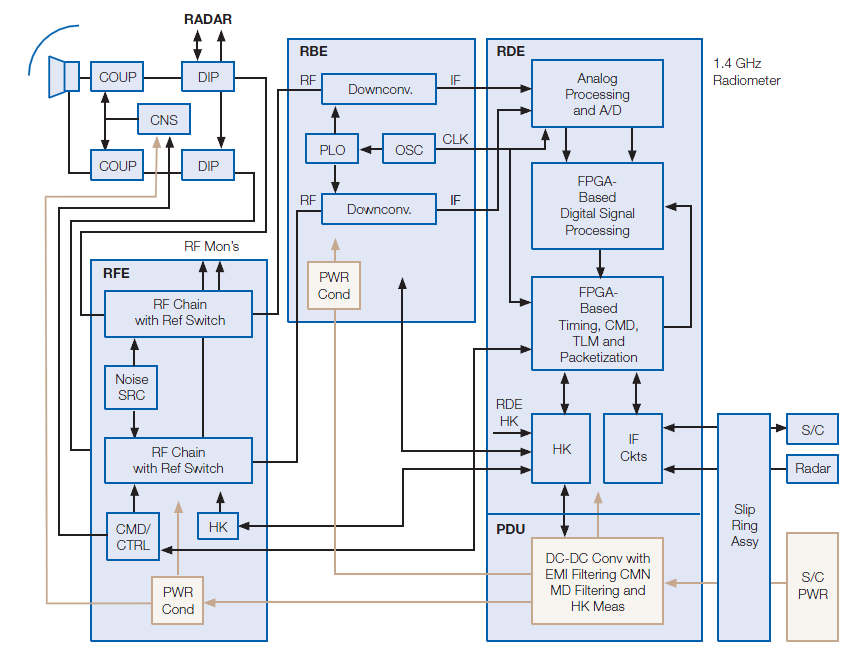
The two polarization channels are then digitized and processed by the Radiometer Digital Electronics at 96MHz with a 14bit resolution. The Radiometer uses a fully digital back-end processor that is in charge of Radiometer Digital Signal Processing and interference mitigation. The Radiometer Digital Electronics represent the first spaceborne back-end processor subsystem. It utilizes FPGA-based digital signal processing which uses time, frequency, statistical and polarization diversity to detect and tag interference events.
The Radiometer Digital Electronics consist of Circuit Card Assemblies, a connector panel and structural components. The Circuit Card Assemblies are comprised of two Analog Processing Units covering the vertical and horizontal channels, performing quadrature down-conversion, subbanding and sub-channel generation. The Data Processing Unit is in charge of controlling all radiometer functions, processing, timing and packetization of data from the radiometer and the digitization of telemetry from all radiometer components. A Power Distribution Unit converts the primary power from the SMAP spacecraft at 28 Volts and generates the different secondary voltages for powering all Radiometer subsystems.
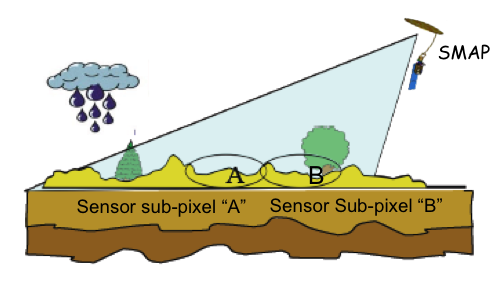
The 49-Kilogram, 1.5 by 0.9-meter L-Band radar delivers radar impulses from a 500-Watt transmitter (peak) that operates at a 2,850 Hz pulse repetition frequency. It operates in a frequency range of 1,217 to 1,298 MHz making measurements in Vertical-Vertical polarization (transmit-receive), H-H and H-V polarization. The radar is operating at an accuracy of 1.0dB. It achieves a ground resolution of 250 by 400 meters and delivers raw data at a rate of 35Mbit/s. The radar employs pulse compression in range and doppler discrimination in azimuth to achieve a sub-division of the antenna footprint in order to reach the desired spatial resolution that surpasses that of the Radiometer.
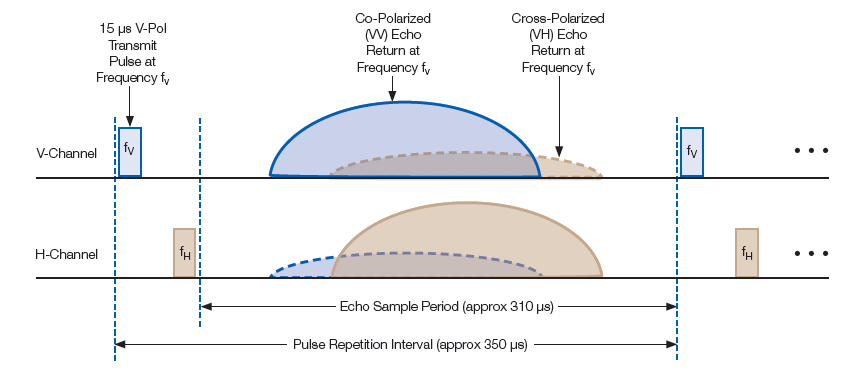
Operating at the normal pulse repetition frequency, the radar transmits two 15-mcirosecond pulses one in vertical and one in horizontal polarization followed by a 42-microsecond dwell time during which the radar echo is recorded and the radiometer completes a single integration with active and passive signals being separated by the diplexer unit.
The SMAP radar is capable of completing initial data processing on board in order to generate the sub-footprint resolution that is necessary for geophysical retrievals. The onboard processor can process raw data into low and high-resolution data that is downlinked to the ground for further processing to deliver low and high-resolution radar products.
One major concern for data accuracy on SMAP is Radio Frequency Interference since the L-Band range is used by many ground-based systems which can pose a major problem when aiming to obtain clean readings without any foreign L-Band emissions.
For the radiometer, a number of techniques are utilized to identify and correct for pulsed and narrow-band sources that may interfere with the instrument. Pulsed sources can be detected through simple time-domain pulse threshold strategies since the sampling rate of the radiometer is very high, allowing sub-millisecond interference detection. Continuous wave detection is more difficult and requires the radiometer’s 24MHz bandwidth to be filtered into sixteen 1.5MHz sub-bands with detected power levels being recorded for each band so that a 1.5 MHz x 1ms spectrogram can be generated to go through different interference detection methods in ground-based data processing.
In contrast to the radiometer, the radar actually operates in a shared band that is also used by civil/military navigation & air traffic comms, so significant interference can be expected. The interference occurs mostly in narrow-bands, but since SMAP’s radar also operates at a 1MHz narrow band chirp a key interference avoidance technique for the radar will be to adjust the center of the transmit frequency. If a persistence source of interference is detected in a given band or over a particular location, the center frequency is commanded to another location in its operational spectrum. Interference detection and removal will be performed as part of ground-based data processing.
Overall, the SMAP instrument will achieve a measurement accuracy of 0.04 cubic meters of water per cubic meter of soil in the top 2-5 centimeters for vegetation water content. Soil Maps will be spaced at 10 Kilometers while freeze/thaw maps can distinguish areas as small as 3 Kilometers.
SMAP Data Paths
Ground Segment
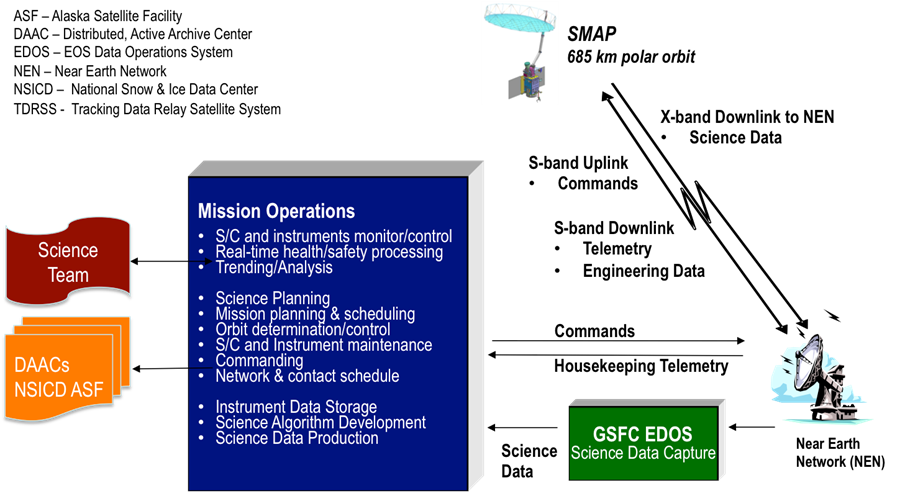
The SMAP ground segment includes components in charge of planning and sequencing spacecraft activities, components that support real time operations and components that enable science data processing and exchange. A high degree of automation is used for real time operations to save overall mission cost. SMAP uses NASA’s Advanced Multi-Mission Operations System to provide telemetry processing, storage, reporting and a subset of automation capabilities for real-time operations.
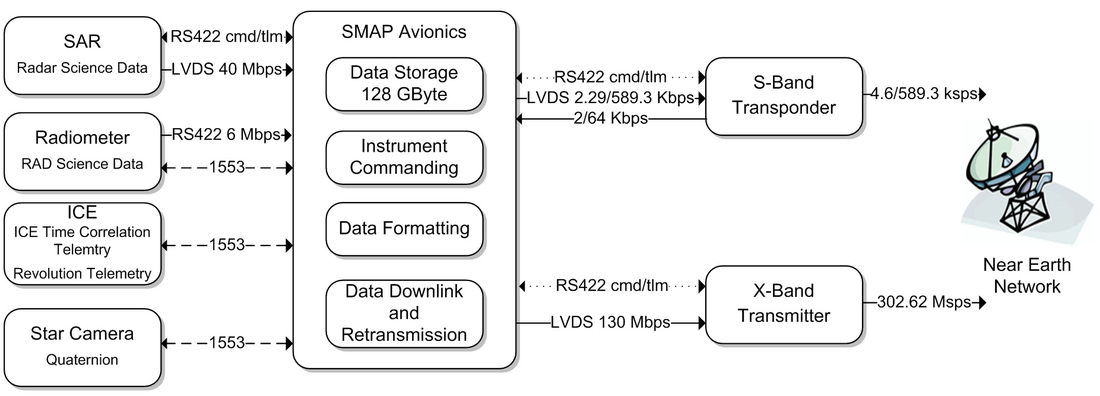
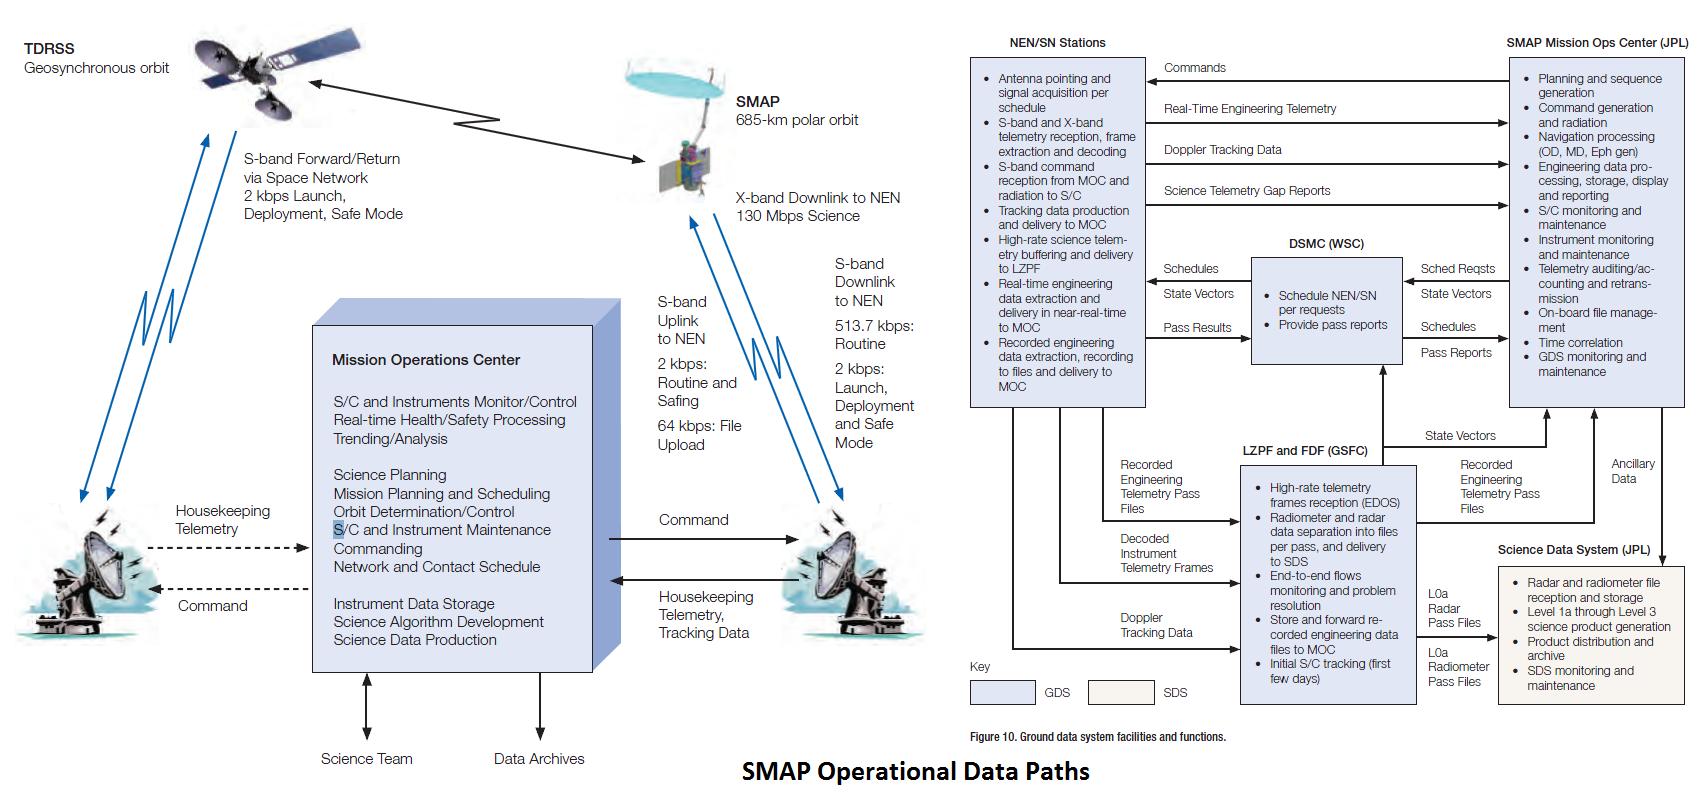
SMAP uses the Near Earth Network to deliver telemetry and instrument data to the ground and receive command sequences several times per day. NEN ground stations used by SMAP include the McMurdo Station in Antarctica with ten contacts per day for at total of 91 minutes, Svalbard Station in Norway with ten contacts per day for 88 minutes, Fairbanks in Alaska with 7 contacts for 54 minutes and Wallops, Virginia with three contacts for 26 minutes. The Tracking and Data Relay Satellite System can be used for housekeeping data downlink and command uplink to the spacecraft in case short-term commanding is needed. Telemetry and housekeeping data is handled in S-Band only while the NEN ground stations support the X-Band downlink at data rates up to 130 Mbit/s. Scheduling and pass reporting are managed by the Data Services Management Center, White Sands.
The SMAP mission operations center at JPL is responsible for spacecraft instrument and bus health monitoring, science and housekeeping operations planning and instrument data storage. Science data downlinked from SMAP is relayed to the Data and Operations System Level Zero Processing Facility at the Goddard Spaceflight Center where raw data is formatted into files and radar & radiometer data is supplied to the Science Data System for further processing. This data is then used by the Mission Operations Center to be combined with housekeeping information such as timing, pointing, and ephemeris information.
SMAP Operational Data Paths
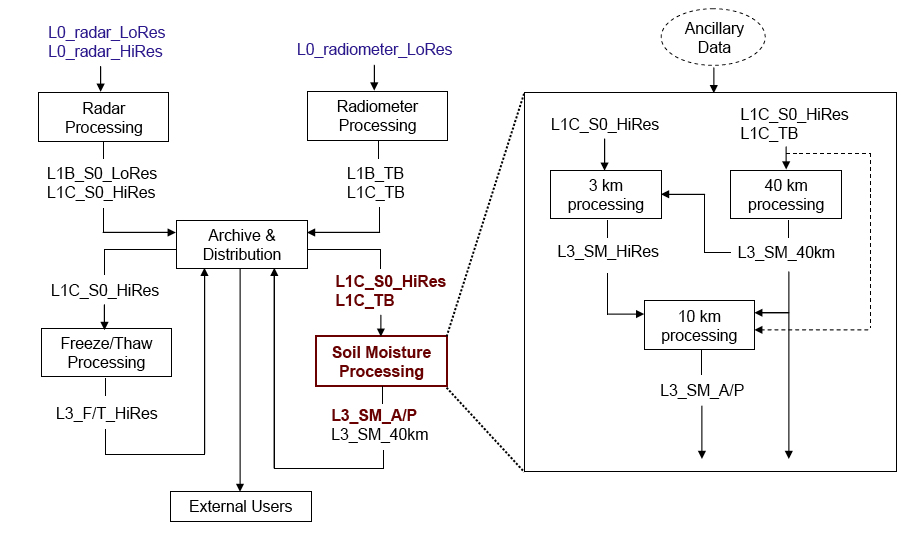
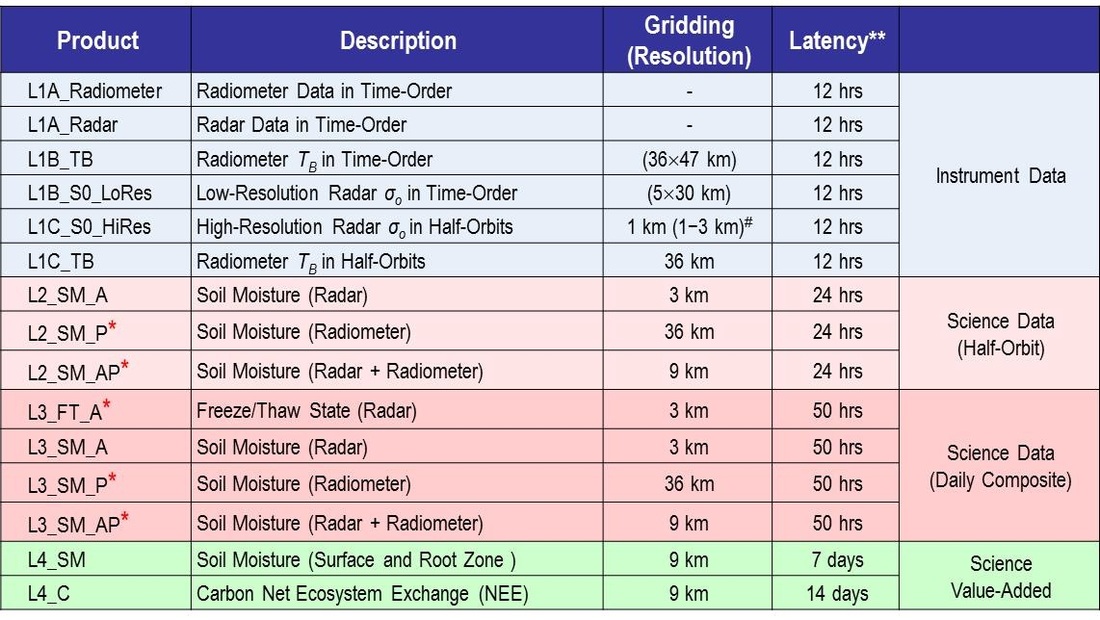
The Science Data Center is required to generate Level 1 data products (time ordered data, radiometer data in half orbits, radar low & high-resolution data) within 12 hours of acquisition for distribution. Level 2 data (soil moisture from radar and radiometer and a combined product) is supplied within 24 hours, Level 3 data (freeze/thaw state, highest resolution of soil moisture data sets) in 50 hour and Level 4 “science value-added” data within two weeks. L4 products represent calibrated soil moisture maps and carbon exchange data at 9-Kilometer resolution. SMAP data is archived at the NASA-designated Earth science data centers at the National Snow and Ice Data Center and the Alaska Satellite Facility.
Data retrieval algorithms for SMAP were developed pre-launch and verified through a series of field campaigns that validated the principles of soil moisture retrievals through SMAP data. These observations were made using airborone sensors covering soils with different water content at different times of year in Canada, the United States and Australia. Further in-situ measurement campaigns will be conducted in coordination with SMAP passes in order to provide calibration data in the early phase of the mission.
A special SMAP Applications Program has been initiated to allow for a better interaction between data application users and mission scientists to better reach users and use their feedback in order to improve data distribution, formatting and other items that allow for a more rapid ingestion of soil moisture data into decision-making environments by the various user groups. The Applications Program has already gained an international membership covering areas such as agricultural productivity, drought & wildfire risk assessment, floods and landslide prediction, human health and national security.
SMAP Data Products
SMAP Science
The overall objective of SMAP is to monitor and map global soil moisture at an unprecedented resolution, sensitivity, spatial coverage and revisit times. Data delivered by SMAP will be used in the examination of the relationship between soil moisture, soil freeze/thaw state, and associated environmental properties in a global scale to put processes into a perspective within the overall land-atmosphere carbon, water and energy exchange and vegetative activity.
Monitoring soil moisture allows insight into evaporation and transpiration rates and processes at the land-atmosphere boundary. Following the global water is important because of the relatively large energy needed to vaporize water, giving it a significant role within the Earth’s energy cycle. Water has a large influence on weather and climate on large and small scales over continental regions. Obtaining correct soil moisture data can enhance weather prediction models, and seasonal climate models.
Gaining a continuous insight into soil moisture variations will allow a better prediction of weather and climate over continental regions with extended lead times and positive effects on socioeconomic activities such as water management, agriculture, flood prediction, drought monitoring and identification of other potential hazards associated with water in the soil. Model predictions of water availability for agriculture and other activities are currently the only way of moisture monitoring. SMAP will deliver data to allow a significant improvement of these models through the collection of space-based soil moisture observations.
Flood forecasts can be improved through the use of high-resolution moisture profiles and freeze/thaw status of areas helping in the identification of possible flood and landslide hazards.
SMAP data will be useful in applied agriculture since water availability and environmental stress are important factors in the estimation of plant productivity and potential yield. Additionally, frost damage can be limited by employing freeze/thaw maps. Another aspect of soil moisture measurements and freeze/thaw status is the application in the prediction of the expansion of many diseases that are constrained by the timing of frozen temperatures and/or water availability. Heat stress and virus spreading rates can also be modeled through the use of this type of data.
Operational application of soil moisture data will be realized in the assessment of ground trafficability for remote operations or military activities. Forecasting of low-level fog, aviation density altitude and dust generation is possible through SMAP data. Furthermore, radar scans over large bodies of water provide information in ice cover, relevant to ship traffic across the globe.
SMAP Mission Objectives (per NASA)
- Understand processes that link Earth’s water, energy and carbon cycles on land. Soil moisture links the water and energy cycles through evaporation, as described in the preceding section, and links the water and carbon cycles through the plant processes of photosynthesis and transpiration. Better measurements of soil moisture are likely to increase scientists’ understanding of how these basic Earth system cycles link together.
- Estimate flows of water and energy between the atmosphere and land globally. SMAP’s highresolution measurements will improve the accuracy of estimates of these important exchanges.
- Quantify the net transfer of carbon between the boreal forests and atmosphere. The overall role of northern forests in the carbon cycle, and their future role, remain unanswered questions. SMAP’s measurements will provide new data on how carbon enters, leaves and is stored in these data-sparse landscapes.
- Enhance weather and climate forecasting accuracy. The patterns of soil moisture affect heating at Earth’s surface and the development of severe weather. With realistic soil moisture inputs into weather prediction models, the forecasts will improve where most needed: over land.
- Develop improved flood prediction and drought-monitoring capability. Knowing soil moisture will allow hydrologists to make better decisions related to the risk of flooding or drought, such as how much water to retain in reservoirs.