
Instrument Overview
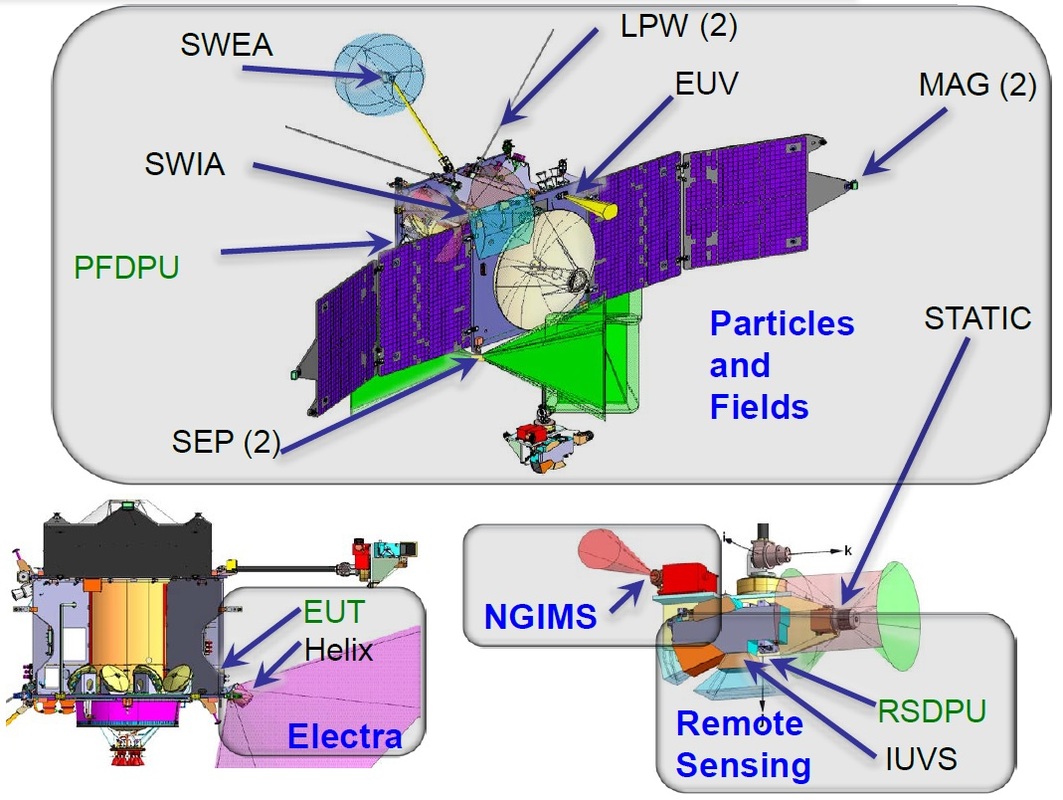
The MAVEN Spacecraft carries a total of eight instruments:
Particles & Fields Package:
- SupraThermal And Thermal Ion Composition (STATIC)
- Solar Energetic Particle (SEP)
- Solar Wind Electron Analyzer (SWEA)
- Solar Wind Ion Analyzer (SWIA)
- Langmuir Probe and Waves (LPW)
- Magnetometer (MAG)
Other Instruments:
- Neutral Gas and Ion Mass Spectrometer (NGIMS)
- Imaging Ultraviolet Spectrometer (IUVS)
Neutral Gas and Ion Mass Spectrometer – NGIMS
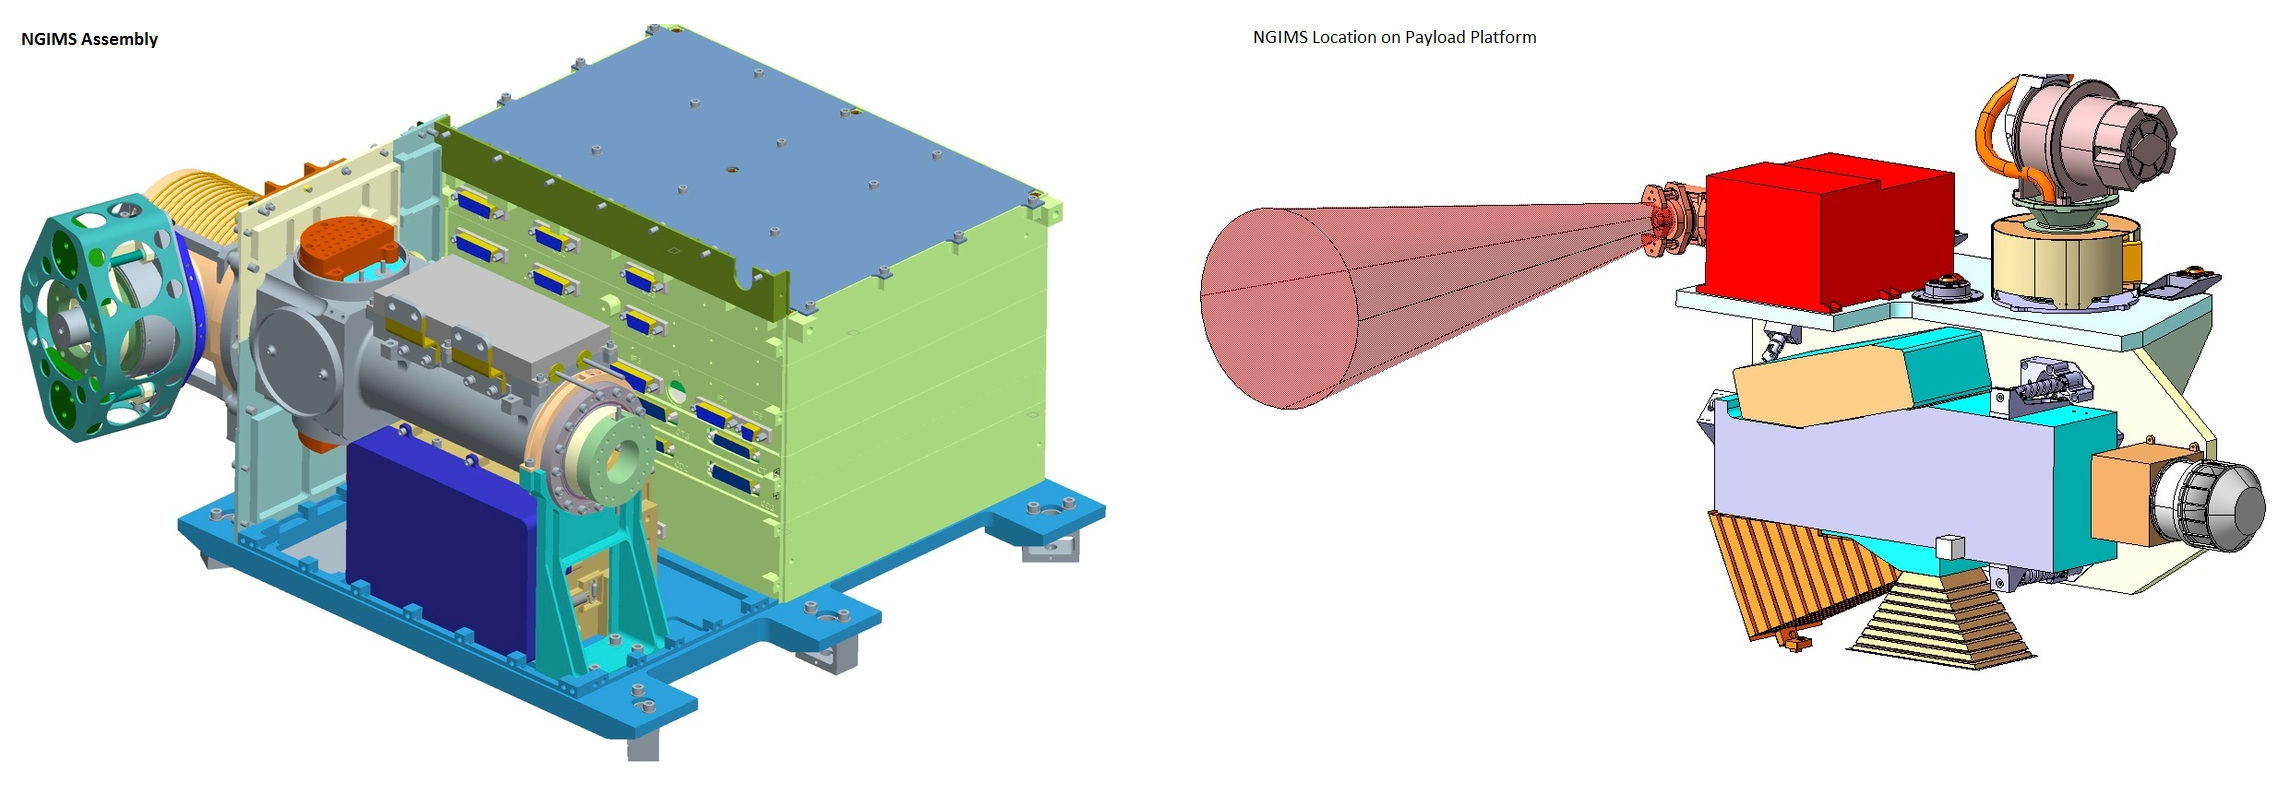
The NGIMS instrument of the MAVEN spacecraft studies the structure and composition of the upper neutral atmosphere of planet Mars, measures isotope ratios, and measures thermal and supra-thermal ions. NGIMS data will be used to produce models of past and present atmospheric loss and a better understanding of the evolution of Martian climate.
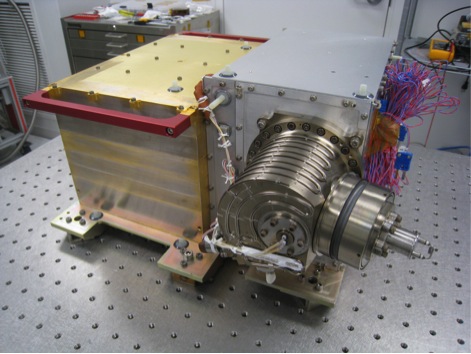
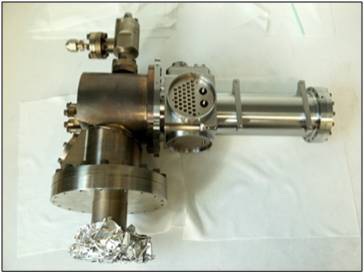
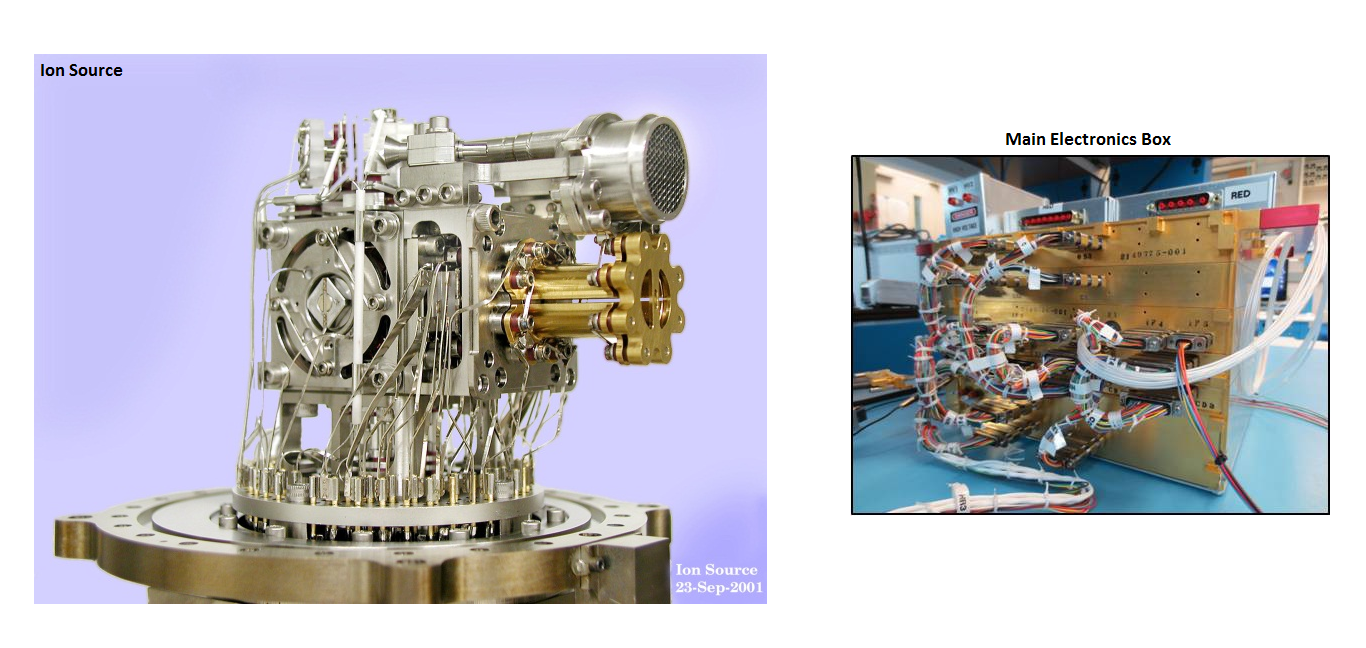
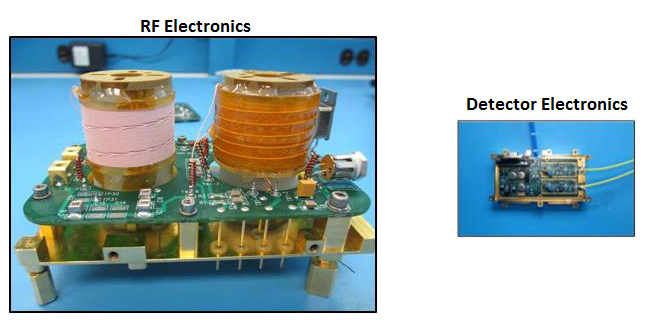
NGIMS is installed on a baseplate that is mounted on the Articulating Payload Platform. The instrument consists of a Quadrupole Mass Spectrometer with open and closed ion source, associated RF electronics, detector electronics, microvalves and a Breakoff Assembly, as well as a Main Electronics Box and its dedicated harness.
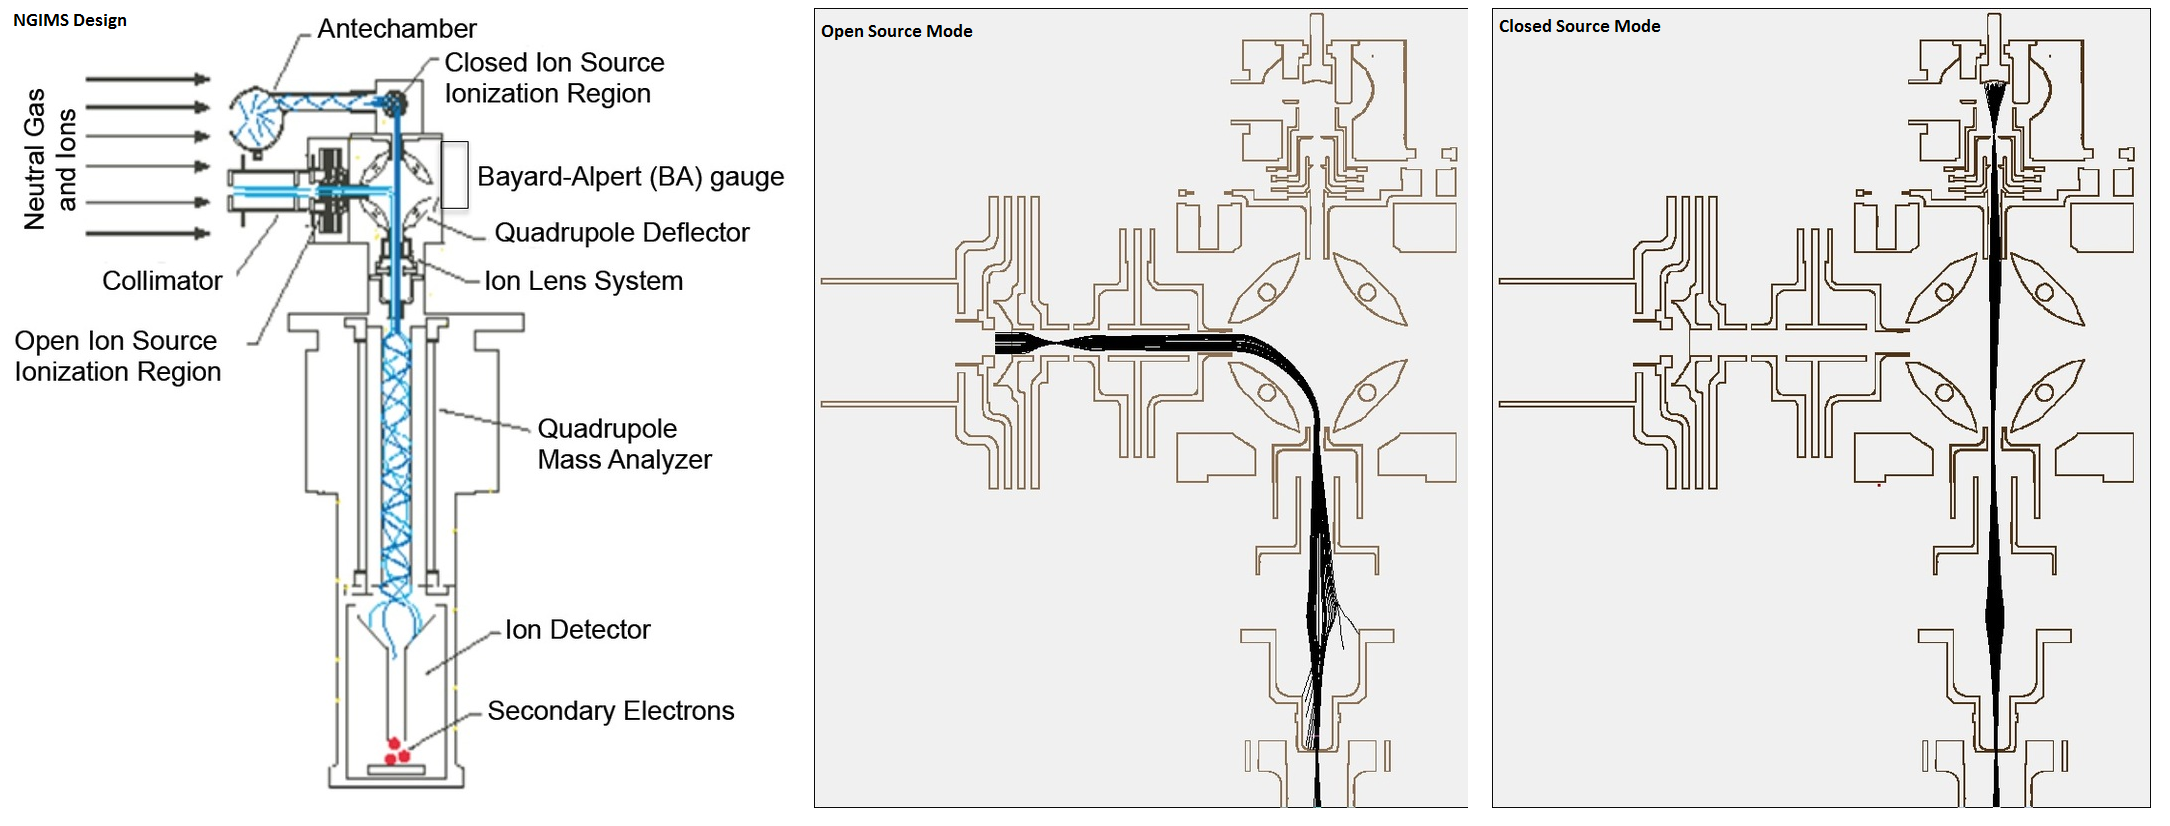
The heart of NGIMS is a Quadrupole Mass Spectrometer, QMS. A Quadrupole Mass Spectrometer consists of four parallel metal rods with opposing rods being connected electrically. A radio frequency voltage is applied between the two pairs of rods and a direct current voltage is then superimposed on the RF voltage.
The RF Voltage is generated by dedicated electronics that reside below the QMS sensor. Ions entering the instrument travel down the quadrupole between the rods.
Depending on their mass-to-charge ratio, ions either enter unstable trajectories and collide with the rods or make it through to the detector. The m/z of ions reaching the detector is a function of the voltage setting which allows the operator to select an ion with a particular mass-to-charge ratio to measure its abundance or run the instrument through a range of voltages to scan for a number of species that might be present. NGIMS uses hyperbolic rods and has a mass range of 2-150 u (atomic mass unit).
To create ions, NGIMS is outfitted with an open and a closed ion source that ionizes atoms and molecules present in the exosphere. The closed source can be used for species that do not adsorb on surfaces within the ion source such as Helium, Argon and non-reactive neutrals as particles collide with the wall of the source multiple times prior to ionization. The open source is suitable for neutrals and ions that are surface reactive. It ionizes species and focuses them into the quadrupole without any wall collisions.
The two sources use electron ionization. Electrons are produced through thermionic emission. The electrons are accelerated to 75 electron volts in an electric field and focused into a beam by a trap electrode. The atoms and molecules enter the ion source perpendicular to the electron beam.
As high-energy electrons pass by and collide with the particles, large fluctuations in the electric field around the neutral molecules are caused leading to ionization and fragmentation. A repeller electrode then attracts the produced cations towards the mass analyzer. NGIMS will also study ambient ions by turning off the electron beam and directing natural ions into the mass spectrometer through the open source.
NGIMS samples thermal and supra-thermal ions with energies below 30 electron volts. The instrument uses a redundant pulse counting multiplier system as detector that has a sample period of 30 milliseconds and an integration period of 27ms at a dynamic range of 10^8.
NGIMS operates in three modes – Standby Mode during which only standby housekeeping data is collected, decontamination mode, and three different science modes. Background Measurements are performed during open and closed source outgassing and for dark current measurements at altitudes of more than 500 Kilometers in order to acquire calibration data. In its nominal science mode, NGIMS measures Neutrals using its open and closed source, and ions with its open source only.
NGIMS scans bands of m/z ranges to search for unexpected species. In case the signal in any of the bands is above the threshold, increased scan time is automatically allocated to that band by the instrument control system. In is survey mode, NGIMS scans in 1/10 or 1 amu steps.
During Cruise to Mars, NGIMS can use Calibration Gas to make open and closed source measurements for instrument calibration.
The NGIMS instrument uses an RS-422 data interface, dedicated power supplies to provide the NGIMS power bus, instrument controllers for command and sequence execution as well as instrument heaters to keep NGIMS in a stable thermal environment. A metal ceramic break-off cap is used to protect the instrument during launch and outgassing.
During science operations, the NGIMS open source axis in ram direction. The ram side of a spacecraft is the side facing the direction of the satellite’s motion. It rams/impacts the he fluid that the satellite moves through, in MAVEN’s case the uppermost atmosphere of Mars to allow neutrals of enter the instrument. NGIMS is usually operated in science mode when MAVEN is below 500 Kilometers to Mars.
NGIMS measures the profiles of Helium, Oxygen, Nitrogen, Carbon Monoxide, Carbon Dioxide, Nitrogen Monoxide and Argon as well as their major isotopes to determine accurate isotope ratios. The positive ions of those species in the thermal range are measured from the ionospheric main peak at 120 Kilometers to the nominal ionopause at 400 Kilometers.
Imaging Ultraviolet Spectrograph – IUVS
The IUVS instrument provides global three-dimensional models of major molecules, atoms, ions and their isotopes in the Martian atmosphere and corona with derived parameters such as exobase and ionosphere altitudes. IUVS studies atmospheric loss and studies the lower atmosphere. Data provided by IUVS allows scientists to characterize the composition and structure of the atmosphere by performing multispecies periapsis limb scans.
Multispectral two-dimensional apoapsis imaging will allow a characterization of spatial distribution and variability. The Deuterium/Hydrogen ratio vs. altitude and the vertical profile of Hot Oxygen is measured via Coronal Scans to study escape processes. The vertical Carbon Dioxide profile is determined by measuring stellar occultations in order to study the underlying atmosphere.
IUVS is installed on the Articulating Payload Platform. The instrument is 71 by 33 by 15 centimeters in size weighing 27 Kilograms. The instrument measures Far-UV radiation at 110 to 190 nanometers and Middle-UV radiation at 180 to 340 nm at resolutions of 0.6 and 1.2nm, respectively.
The IUVS instrument is equipped with two fields of view – a 24 by 11-degree Limb FOV and a 55 by 11-degree Nadir-pointing FOV. The spectrograph is a modified Czerny-Turner Design. In the common Czerny-Turner design, light is directed through an entrance slit (available light energy depends on light intensity of the source as well as the dimensions of the slit and acceptance angle of the system). The slit is placed at the effective focus of a collimator that directs collimated light (focused at infinity) to a diffraction grating or prism. Another mirror refocuses the dispersed light onto a detector. The specific IUVS design is more complex because of the two different fields of view and different scanning methods.
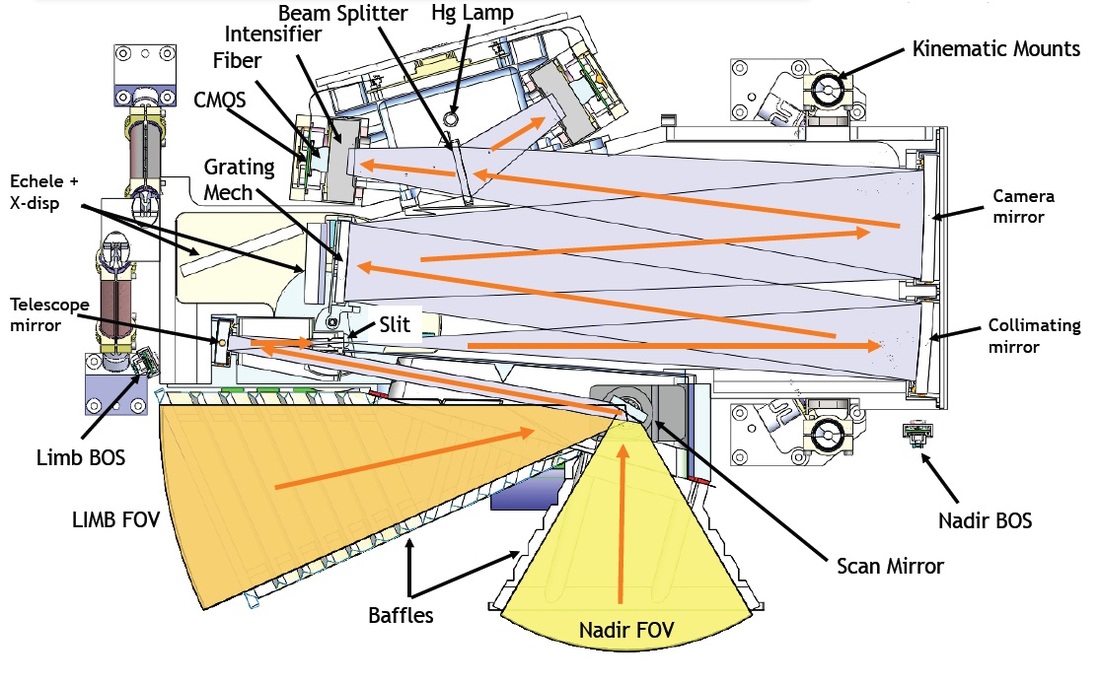
A plane scan mirror is used to select the field of view and reflects incoming radiation onto a single, spherical mirror that images the Marian atmosphere onto the 0.1 by 11-degree entrance slit. After passing through the entrance slit, the light is collimated by a spherical mirror before reaching the dispersive element of the spectrograph.
A stepper motor can either place a normal-incidence grating in the optical path for nadir viewing or rotate it out of the path to expose a a prism-echelle grating combination for limb viewing. The nominal incidence grating operates at wavelengths of 110 to 340 nm at a medium resolution while the cross-disperser and echelle grating covers the region of 120 to 131 nm with an extremely high resolution.
(The wavelengths of the resonance lines of Hydrogen at 121.567 nm and Deuterium at 121.533 nm require a high resolution to resolve them as separate lines for spectroscopic analysis. The other grating provides a medium resolution to make spatial maps of upper-atmosphere neutral and ionized species that produce atomic-line and molecular-band emissions in the region of 115 to 340 nm.)
The grating disperses the light into two different diffraction orders – 180 to 340nm first order and 110 to 190nm second order. A toroidal camera mirror then re-focuses the dispersed light. Next, a quartz-area division beam splitter splits the light into far and middle UV radiation. The splitter transmits radiation with wavelengths greater than 180nm to the middle ultraviolet (MUV) detector while the rest of the first-order and second-order light is reflected to the far ultraviolet FUV detector.
The MUV detector consists of an image intensifier with a cesium telluride photocathode. The MUV output is coupled to a Complementary metal–oxide–semiconductor array via a fiber-optic taper.
The FUV detector is identical to the MUV, but uses a photocathode that consists of Cesium iodide. Cesium iodide is ‘solar blind’ – it is very insensitive to wavelengths greater than 200nm. This enables the FUV instrument to only detect the desired second order wavelengths, excluding the MUV radiation coming from the atmosphere and solar continuum radiation reflected by the Martian surface.
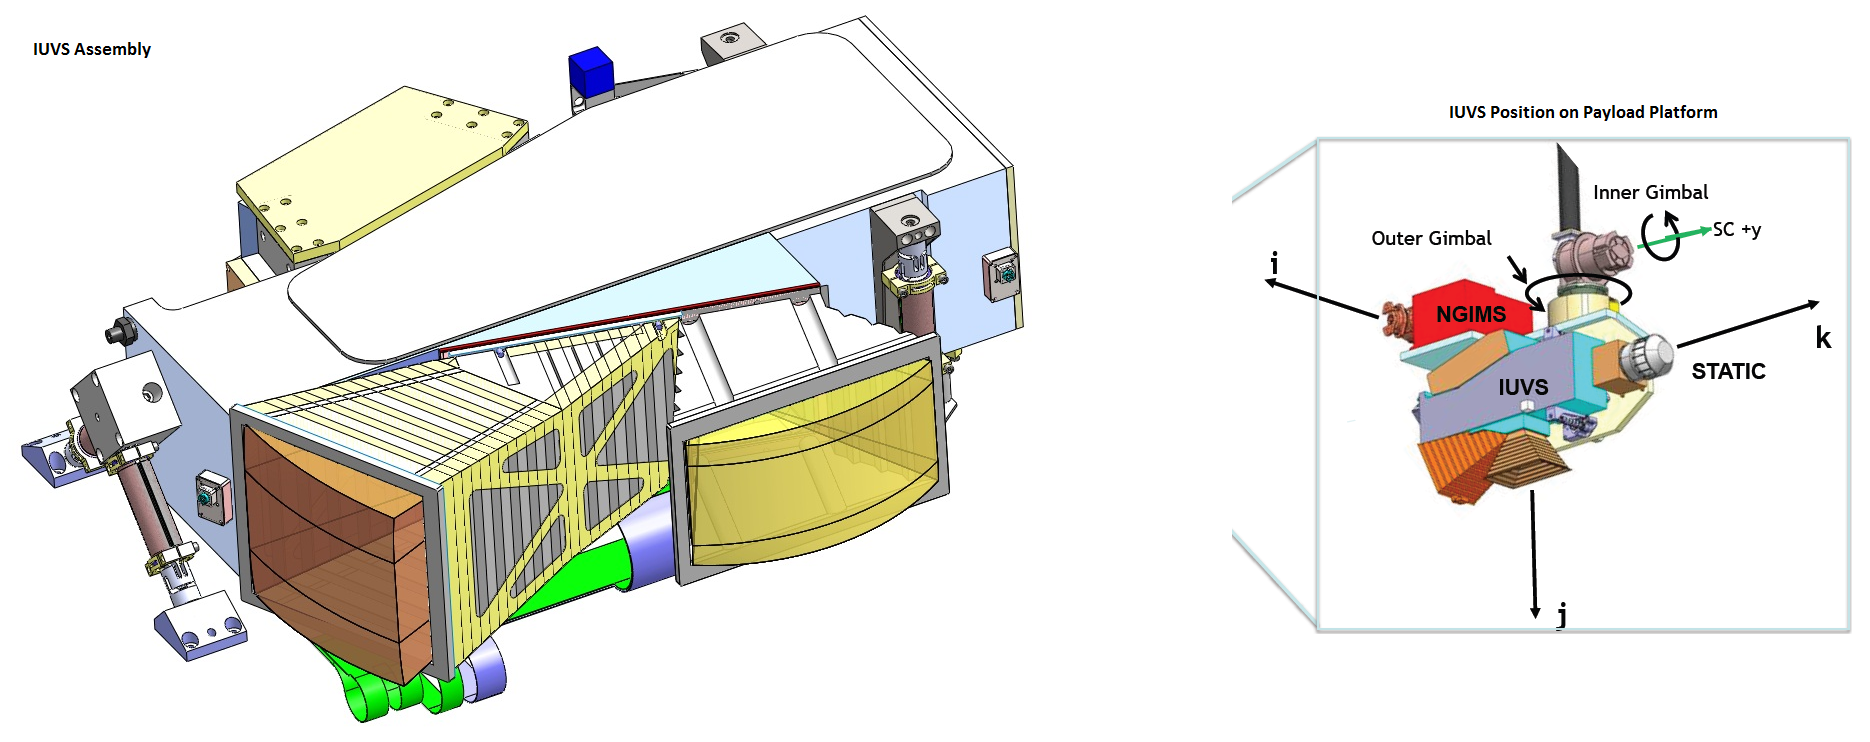
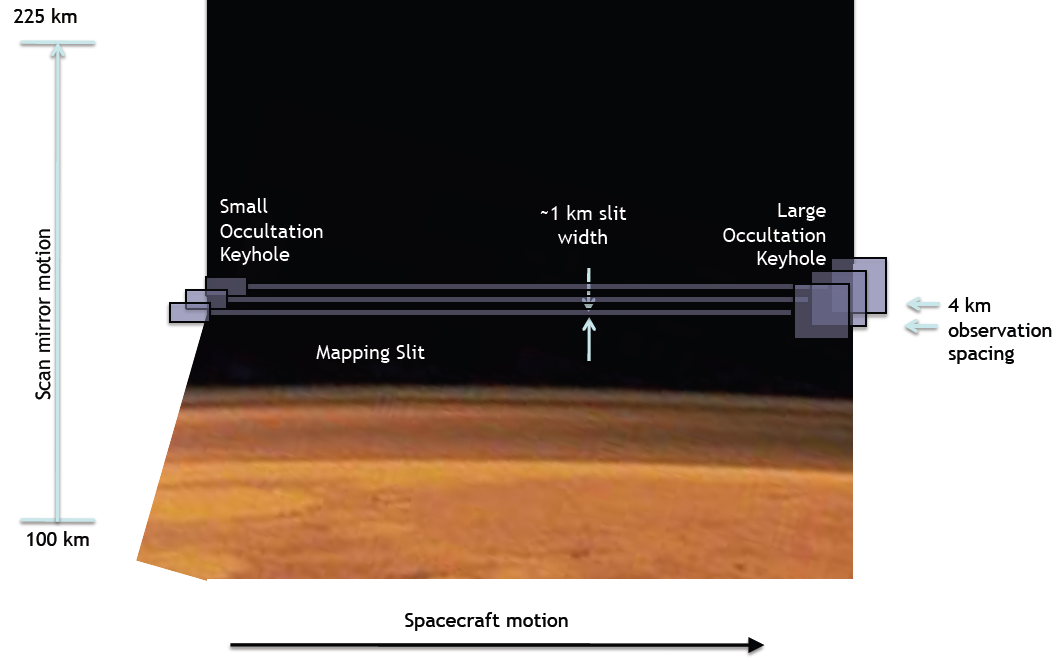
When in its orbit around Mars, MAVEN will orient its Articulating Payload Platform to position the center of the limb FOV perpendicular to the spacecraft velocity vector and approximately 12° below horizontal. Fine rotations of the scan mirror project the limb onto the entrance slit so that it slowly traverses the desired altitude profile from 100 to 225 Kilometers with a sampling interval of four Kilometers and a projected slit-width of one Kilometer. At each altitude, the instrument makes MUV and FUV measurements. Near periapsis IUVS measurements alternate with STATIC and NGIMS operations as these instruments share their articulating payloads platform.
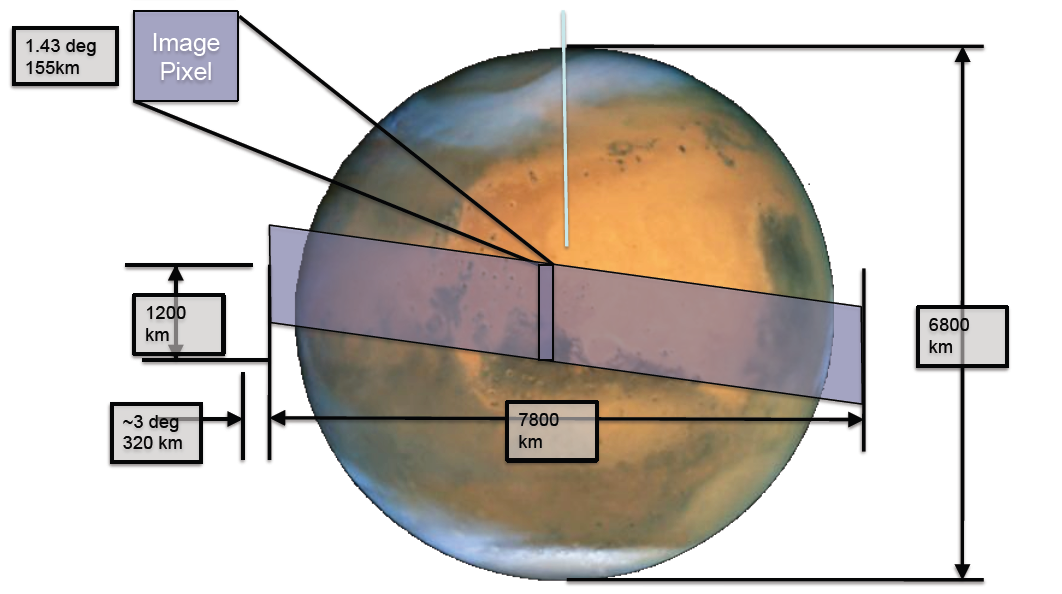
Around apoapsis, IUVS provides global images of the upper atmosphere with no detailed altitude information. In this observation mode, IUVS uses it nadir FOV with the spectrograph slit oriented perpendicular to the spacecraft orbit’s major axis. Scan mirror motions allow the instrument to cover a large ground swath with a resolution of 160 Kilometers.
In between periapsis and apoapsis passes, IUVS uses its two different gratings to make measurements of Hydrogen and Deuterium as well as Oxygen escaping from the Martian atmosphere. Also, IUVS can study the lower atmosphere from 30 to 100 Kilometers. To do that, IUVS is oriented so that a chosen star is imaged into one of two keyholes located at either end of the entrance slit (a Large and Small Occultation Keyhole). As the spacecraft orbits the planet, the atmosphere passes in front of the star, absorbing its light.
IUVS can determine the amount of absorbed starlight to determine the concentration of Carbon Dioxide, molecular Oxygen, ozone and aerosols to characterize the lower atmosphere. Stellar imaging is completed as part of dedicated one-day campaigns occurring once every two months to make five consecutive measurements of one star to achieve full longitudinal coverage as Mars rotates once every five MAVEN orbits.
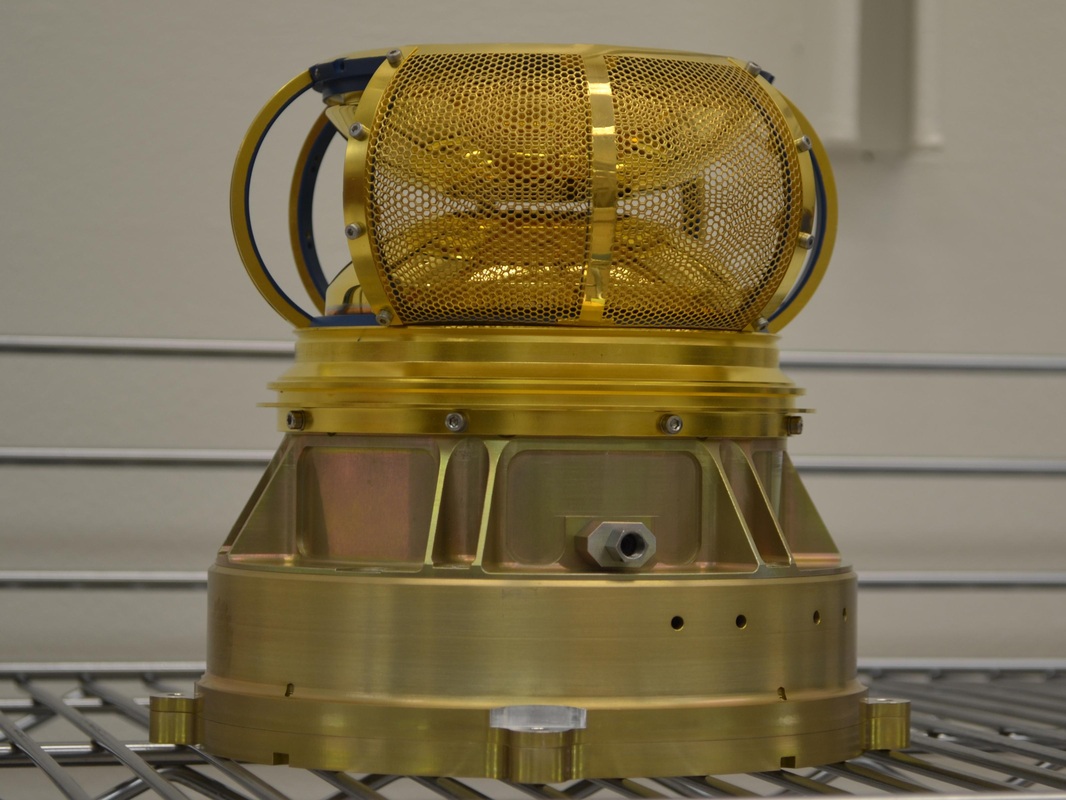
SupraThermal And Thermal Ion Composition – STATIC
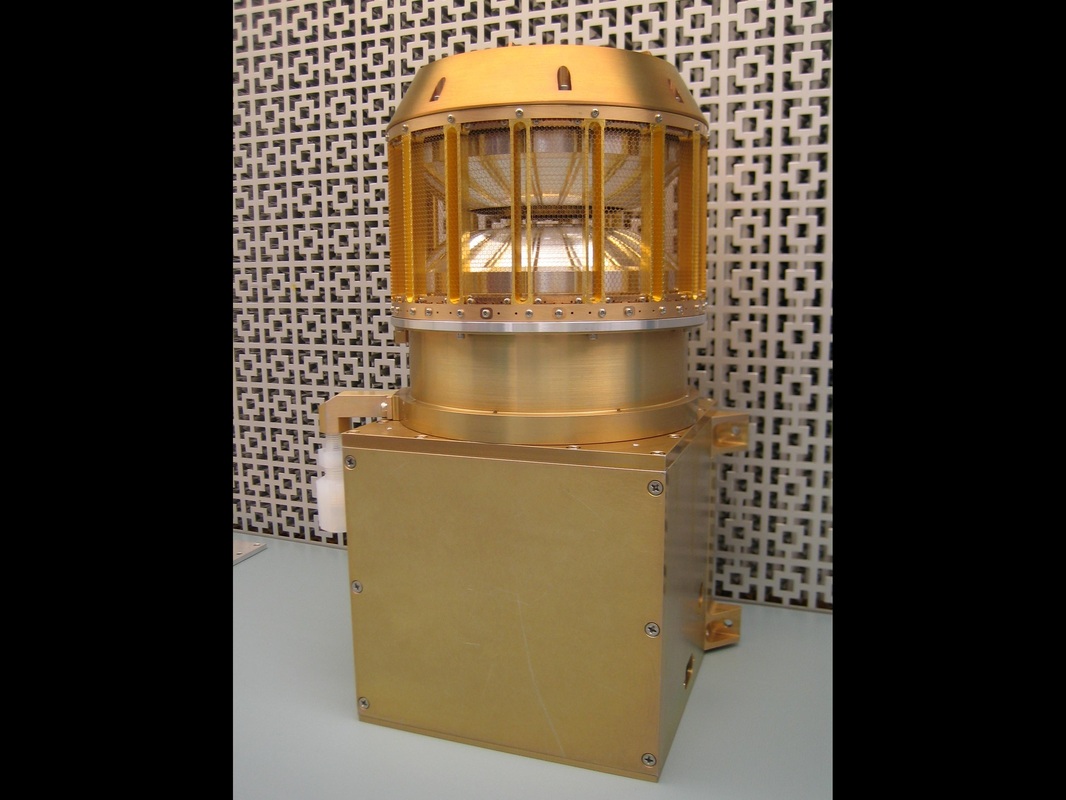
The STATIC Instrument is part of the Particles and Fields Package of the MAVEN spacecraft and studies thermal and suprathermal ions escaping from the atmosphere of Mars.
STATIC measures thermal ionospheric ions at energies of 0.1 to 10 electron volts with an expected peak flux at 2 to 3eV. Suprathermal ions from 5 to 100eV with escape velocities are also measured as well as Pick-up ions with energies of 100 to 20,000eV.
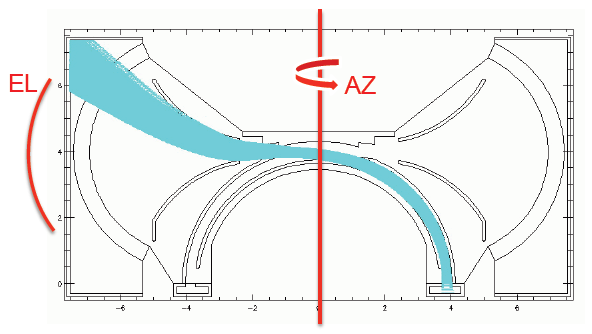
STATIC is a toroidal electrostatic analyzer with a Time of Flight Section that measures ions over a broad energy range and up to 70 atomic mass units. The instrument has a field of view of 90 by 360 degrees minus minor losses due to spacecraft structural obstructions. STATIC has an angular resolution of 22.5 by 6 degrees (azimuth vs. elevation).
Incoming ions pass through the analyzer entrance before passing a small slit attenuator. Two deflectors, one upper and one lower, change the path of the ions based on their energy before the ions reach the electrostatic analyzer. The ions are post accelerated by 15keV.
After passing the deflectors, the ions pass through a thin carbon start-foil which generates secondary electrons. These electrons are then accelerated & deflected and are detected in a dedicated position on the Microchannel plate detector to generate a start pulse.
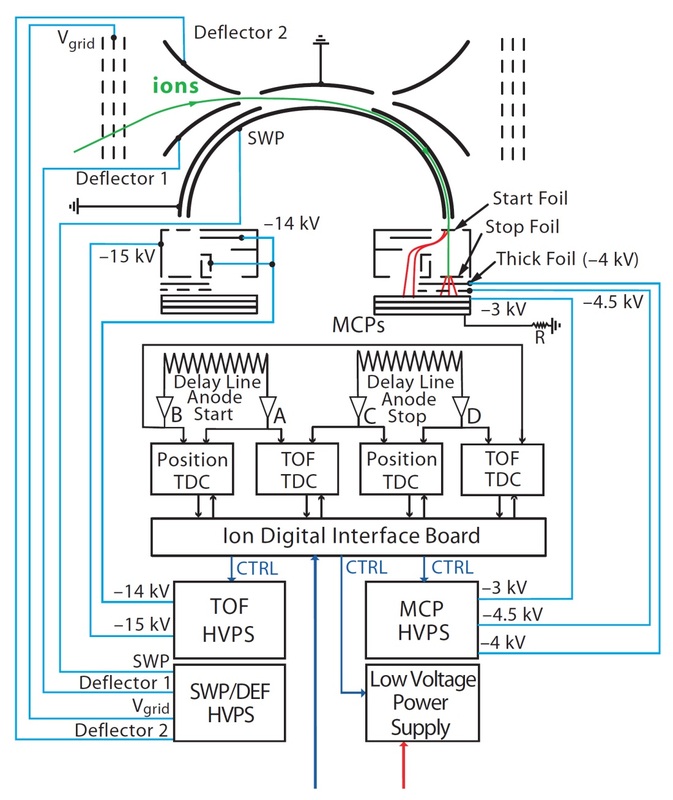
The ions traverse 2 centimeters from the start foil to the stop foil, where secondary electrons are generated once again. Those stop electrons are then accelerated by a 10kV electric field and penetrate the thick foil and strike the Microchannel Plate Detector to generate a stop pulse in order to determine ion time of flight.
The azimuth angle of impinging ions is determined by measuring the position in which the electrons impact the detector with a position-sensitive anode while the elevation angle is measured perpendicular to the imaging plane to determine the direction of incoming electrons.
There are a total of 16 anode bins, each covering 22.5 degrees to make up the 360-degree field of view.
Protons that penetrate the stop foil are captured by the thick foil before being reflected. Separate delay line anodes for the Start and Sop pulses allows time and position coincidence for noise rejection.
The anode board features the 16 anodes that are arranged in a circular pattern. A 2ns delay chip is installed on the back of the board in between back of the anode pads as the individual anodes act as transmission lines. The delay between signals coupled with the information which signal arrives first provides the position of the ion. The raw anode input is then processed by the Preamplifier board that generates an amplified output of the MCP signals. Time to Digital Converters are used to generate digital TOF and position signals that are sent to the Ion Digital Interface Board for processing, storage and downlink.
Also part of the instrument are High Voltage Power Supplies that generate the high voltages (up to 15kV) that are needed by the deflectors and analyzers.
A Low Voltage Power Supply is connected to the 28V main bus of MAVEN and produces the low voltages for the electronics of the instrument.
The Ion Digital Interface Board commands all high-voltage power supplies, processes raw count data from all events on all sensors, and determines the coincidence in the ion sensor. Anode counts from each sensor are de-serialized and recorded in histograms or real-time count-rate registers. TOF data is generated by a Time-to-Digital converter. Also, test pulsers can be used by the IDIB to check all the amplifiers used in the individual instruments. IDIB also measures housekeeping telemetry parameters that can be stored and read-out for downlink to the ground to provide insight into instrument health.
Solar Wind Electron Analyzer – SWEA
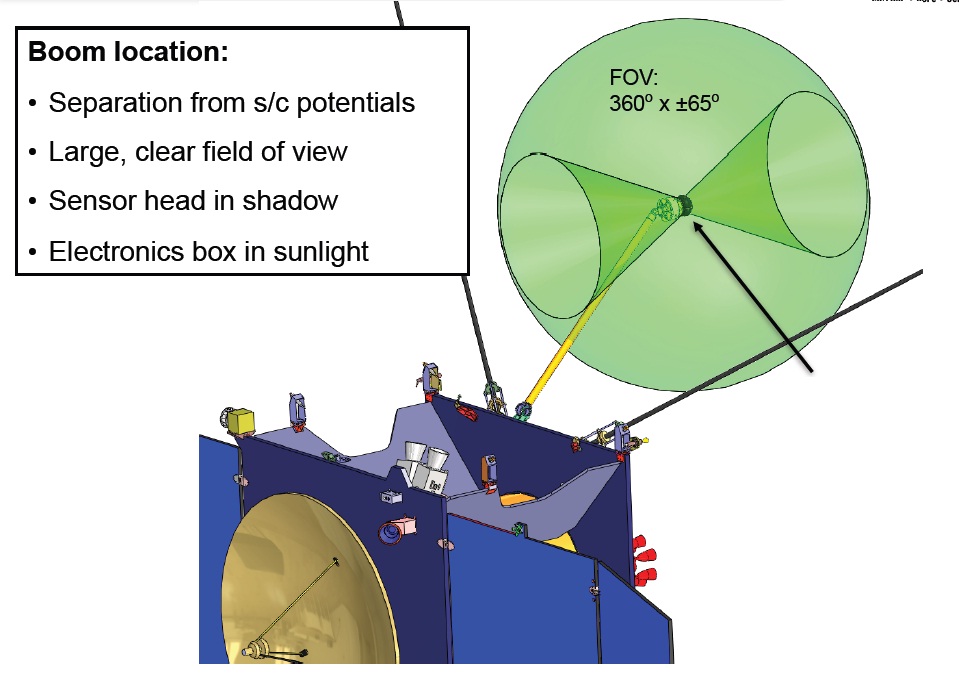
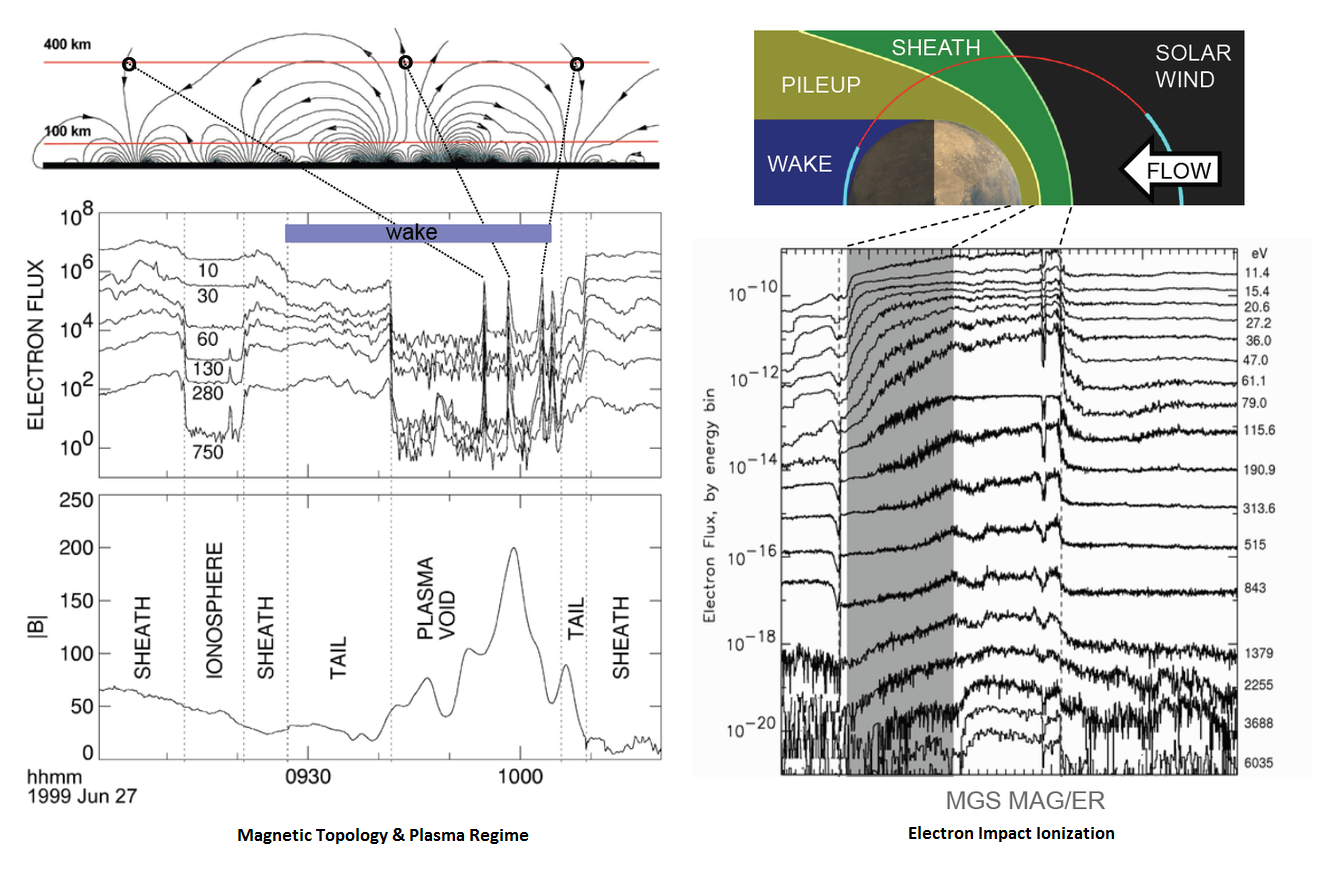
The SWEA instrument measures electron impact ionization rate, magnetic field topology, plasma regime, photoelectron energy spectra, auroral electron properties and the interaction of solar wind with the Martian Atmosphere. The instrument measures energy and angular distributions of solar wind and magnetosheath electrons as well as ionospheric photoelectrons from 5 eV to 6 keV. Continuous measurements are made by the system with 10-second resolution to resolve magnetic cusps and bow shock.
The SWEA instrument is installed on a dedicated boom mounted in between the two LPW booms to separate the instrument from the spacecraft potential and accommodate the large field of view of the instrument. Also, it ensures that the sensor head is in shadow while the electronics box is in sunlight. The instrument weighs 1.4 Kilograms.
SWEA has a field of view of 360 degrees by +/-65 degrees and an angular resolution of 22.5 by 7 degrees.
The SWEA field of view is electrostatically deflected into a cone up to +/-65-degrees out of its normal plane by a voltage that is applied to curved plates located at the analyzer entrance.
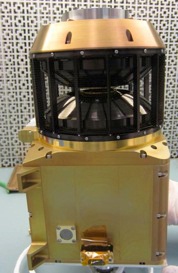
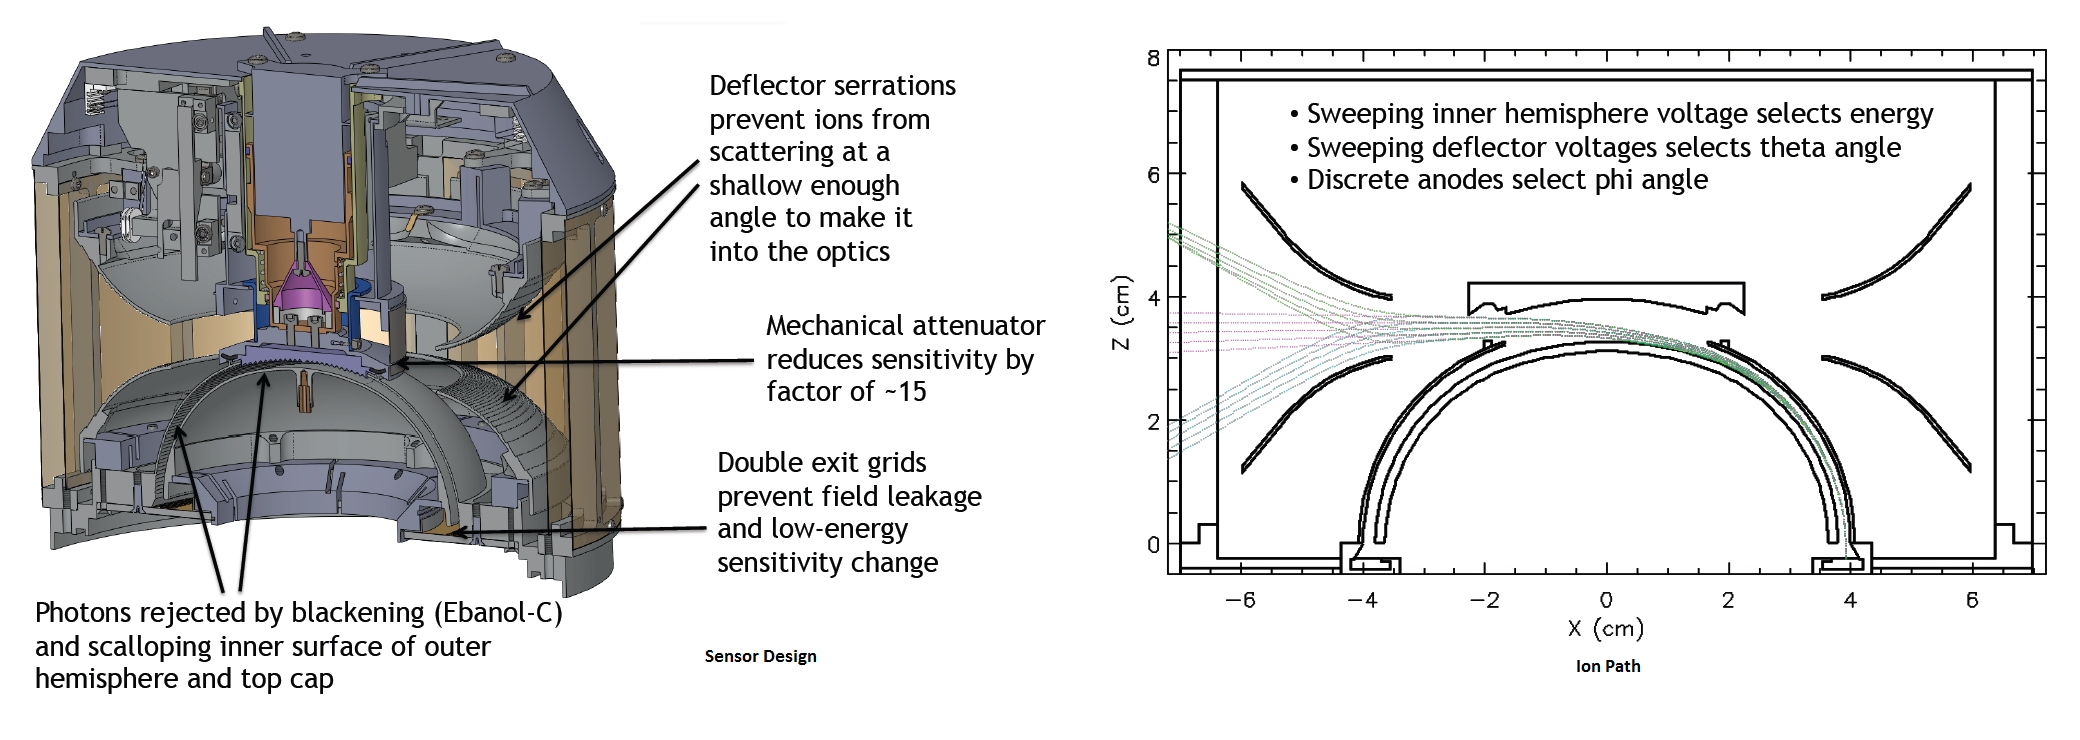
SWEA is a hemispherical electrostatic analyzer. Two deflectors are open to space though the aperture grid of the sensor that also provides thermal isolation. The deflectors consist of gold plated Ultem. The deflectors change the path of the electrons based on their energy before the electrons reach the electrostatic analyzer that selects the energy of the deflected electrons.
The SWEA inner plate radius is 3.75 cm and the plate separation is 0.28 cm. The resulting energy resolution dE/E is 18%
After passing through the instrument, the electrons impact on a Microchannel Plate detector featuring 16 anodes that are arranged in a circular pattern making up the planar 360-degree field of view. Azimuth of an incoming electron is is measured by determining which anode the electron hit which provides an accuracy of 22.5 degrees. The elevation angle is measured perpendicular to the imaging plane to determine the direction of incoming electrons.
Charge pulses that are generated by the MCPs are collected on the 16 anodes of the instrument. The signals are then transmitted to the Charge Amplifier Board that features 16 A111F Amptek charge amplifiers that process the individual MCP pulses to generate a digital output. The board also features a pulse generator to produce test pulses on the input of each amplifier for instrument checkouts. The maximum count rate of the amplifiers is 2×10^6 pulses per second.
SWEA also has a High Voltage Power Supply that provides four positive high voltages and one negative high voltage to compensate the spacecraft potential. The MCP is supplied with a voltage of 3,200 Volts that is adjustable via analog commanding.
The other three HVs supply the optics of the instrument – one for the electrostatic analyzer with a range of 0 to 750 Volts and two for the two deflectors with a operational range of 0 to 1,500 Volts. The voltages are controlled via the Digital Control Board of the instrument. A Low Voltage Power Supply regulates the 28-Volt main bus down to 5 volts and 3.3 volts for the instrument electronics.
The digital board of the SWEA instrument executes all commands and actuates all other instrument tasks. It also processes and transmits instrument telemetry and science data for transfer to the Particles & Fields Data Processing Unit for storage and downlink.
SWEA provides a single science data product to the Particles & Fields Data Processing Unit consisting of the counts per accumulation interval for each of the 16 anodes as a function of analyzer and deflector sweeps. The complete measurement sequence requires two seconds. In its Ionosphere Mode below 500 Kilometers in altitude, SWEA collects a full set of energy spectra and pitch angle distributions every two seconds and three-dimensional distributions every 64 seconds. Above 500 Kilometers, SWEA is in Solar Wind Mode, acquiring a full data set of energy spectra and pitch angle distributions every eight seconds and 3D distributions every 64 seconds.
Solar Wind Ion Analyzer – SWIA
The SWIA instrument measures the density and velocity distributions of solar wind and magnetosheath ions to determine the exchange rate and the plasma flow from solar wind speeds of 30 to 2,000 Kilometers per second down to stagnating magnetosheath speeds. Those measurements will provide data on the total solar wind input to the Martian atmosphere and provide insight into basic space plasma processes around Mars.
SWIA is installed on the instrument deck of the MAVEN spacecraft. The SWIA instrument measures ions with energies of 5 to 25,000 eV at an energy resolution of 13.5%. The instrument field of view is 360 by 90 degrees. SWIA has an angular resolution of 22.5 degrees with 4.5-degree detectors in sun direction. Measurements are made at a cadence of four seconds.
SWIA, SWEA and STATIC are similar in design – all three being toroidal analyzers. The SWIA instrument also features two deflectors that are open to space. The instrument is protects by two entrance grids with a transmission rate of 90%. The deflectors change the path of incoming ions that pass the electrostatic analyzer before they reach the Microchannel Plate detector. The SWIA MCPs feature MCP Chevron Pairs with the front biased to –2 to –3 kV and the output face at 50 Volts, connected to the anode pads of the instrument. SWIA features a total of 24 anodes – 10 small anode pads of 4.5 degrees and 14 anode pads at 22.5 degrees, arranged in a circular pattern to create the 360-degree planar field of view.
The small anode pads are centered around the boresight of the instrument that will be pointing to the sun during nominal operations to offer a better resolution of solar wind ions of 4.5 degrees. All other locations have a resolution of 22.5 degrees.
The anodes interface with the pre-amplifier board that features a total of 24 A121 charge amplifiers that process the individual MCP pulses to generate a digital output. Next, the Digital Board uses the pulses provided by the 24 A121 amplifiers. Passive termination is utilized to translate the 5V level outputs. Digital SWIA signals are then transmitted to the Particles & Fields Data Processing Unit for eventual downlink.
Dedicated High-Voltage and Low-Voltage power supplies provide the high voltages for the deflectors, the analyzer and the MCPs while the low-voltage is needed for the instrument electronics.
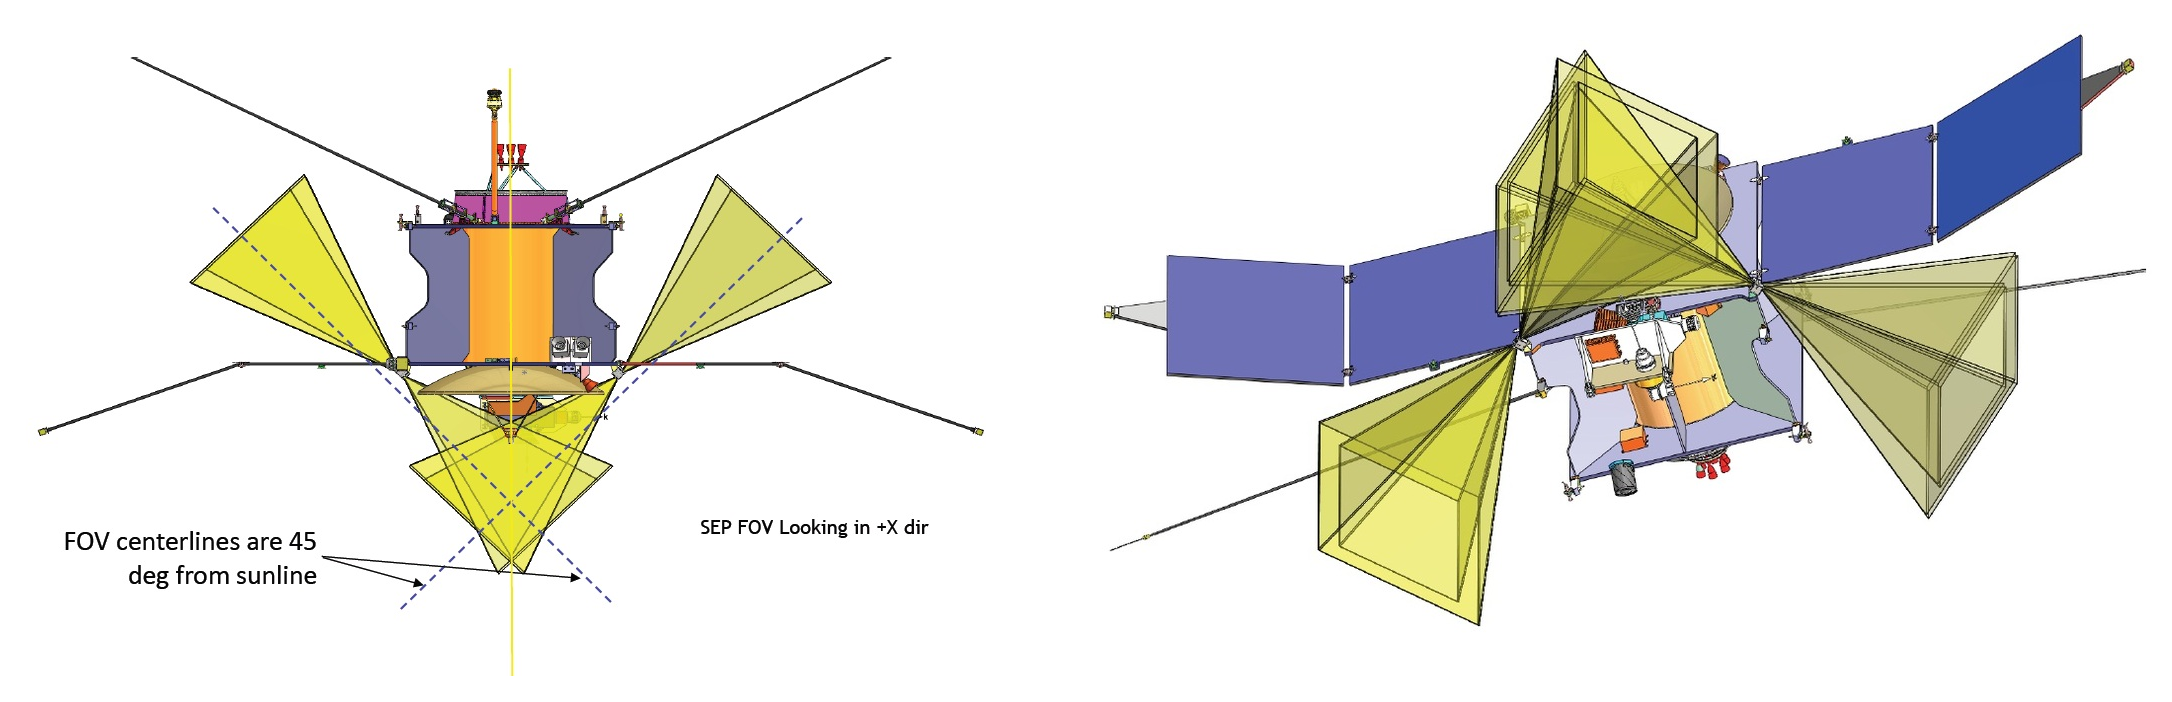
Solar Energetic Particle – SEP
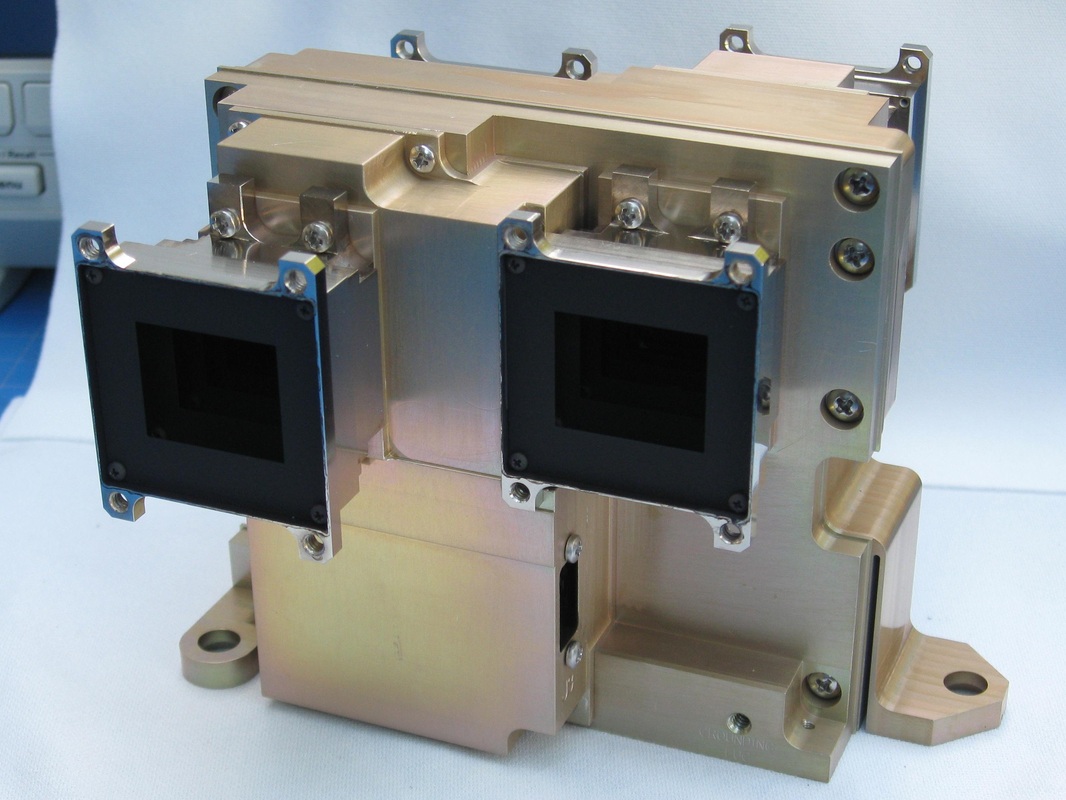
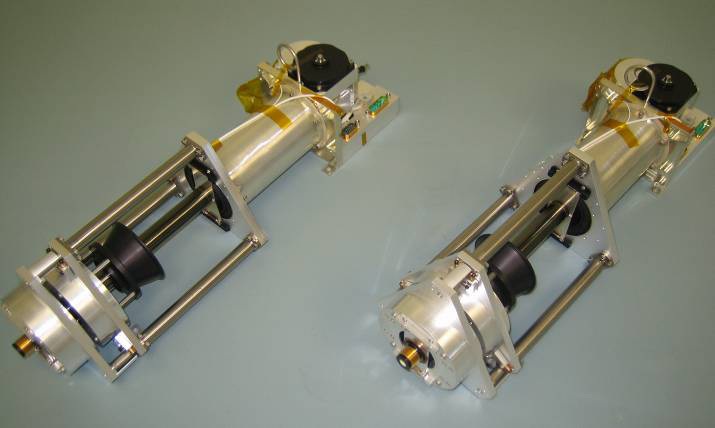
The SEP instrument measures solar particles at an energy range that affects the upper Martian atmosphere, also studying ionospheric interactions at a high temporal resolution. SEP features two dual double-ended telescopes creating four look directions. The instrument measures protons and ions at energies of 25 keV to 12 MeV and electrons from 25 keV to 1 MeV at an energy resolution of 50%.
Each SEP sensor has four collimators. Each look direction is either sensitive for electrons or ions. One ion and electron side faces the same direction to achieve a bi-directional field of view with full particle coverage.
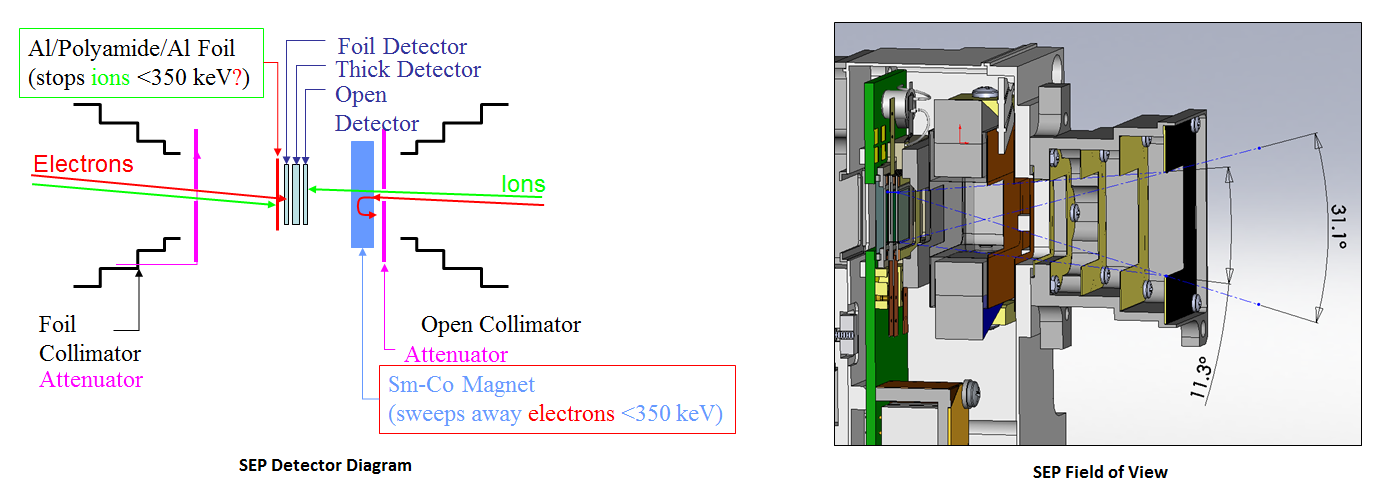
SEP uses foil collimators on the electron side and open collimators on the ion side. The collimator field of view on SEP is 11 by 31 degrees. Both sides feature dedicated attenuators. The instrument uses mechanical pinhole attenuators that protect SEP against overheating when the sun is in the field of view. The attenuator also reduces the count rate during periods of high flux and reduces radiation damage caused by low-energy ions during periods of high flux. Attenuator control is provided by two Honeywell Switches.
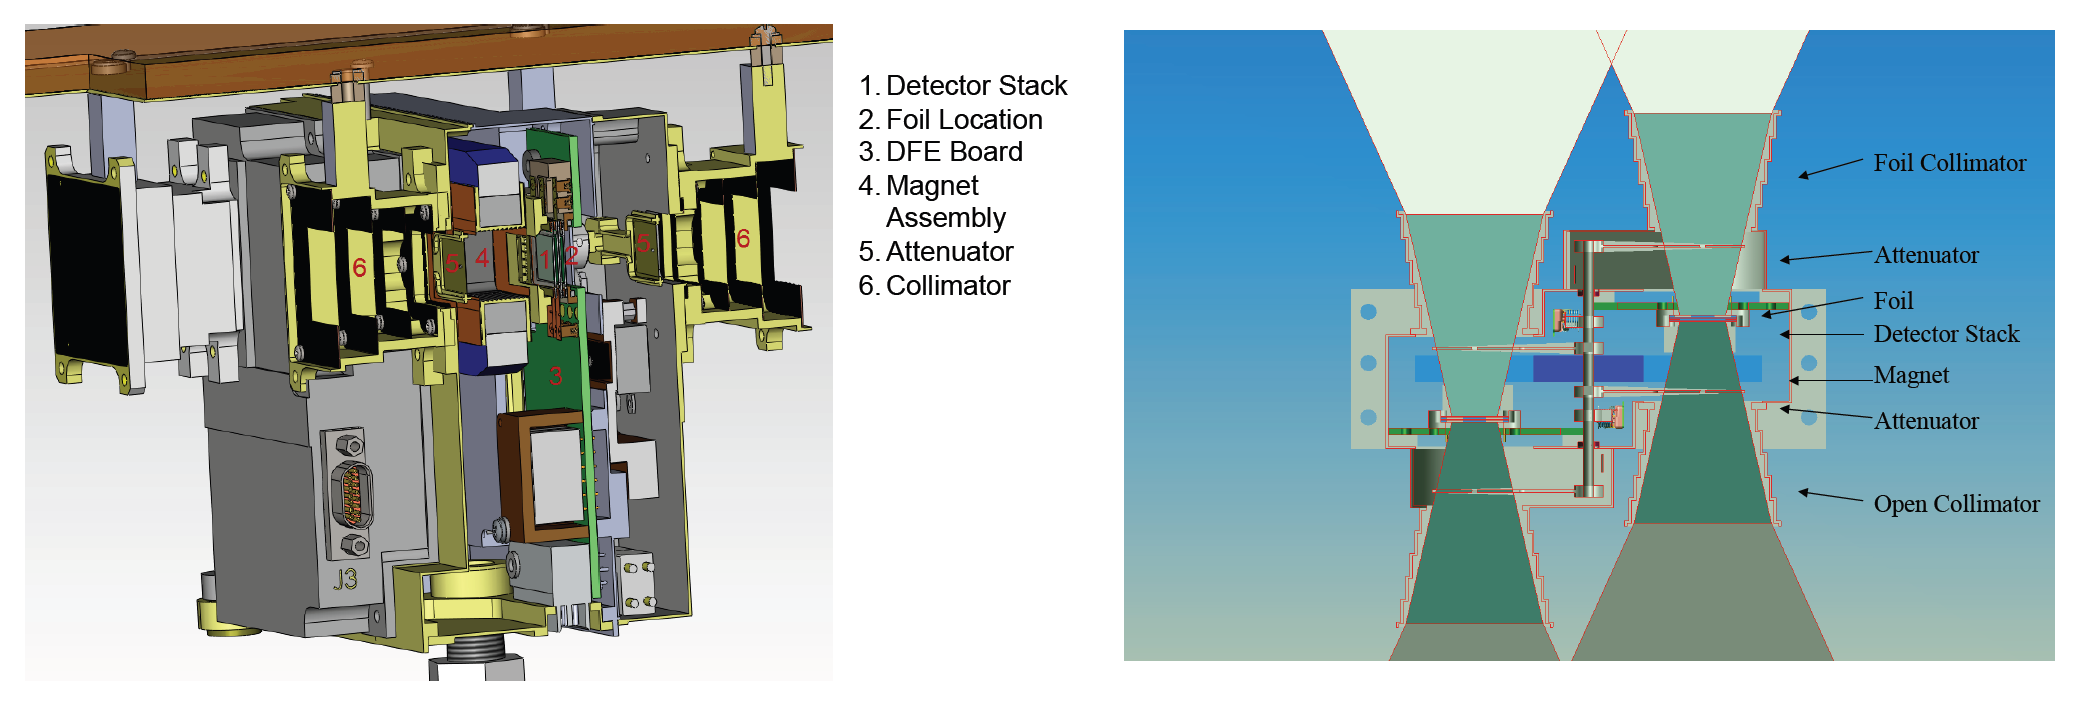
The detector assembly is a triplet stack of silicon solid state detectors. The detector plane is 13.2 by 8.2 millimeters in size. On the electron side, the detector assembly is shielded by an Aluminum-Polyamide-Aluminum Foil 1.8mm from the detector that stops ions under 350keV while leaving the electron flux above 20 keV nearly unchanged. The ion side features a Samarium-Cobalt magnet that sweeps away electrons under 350 keV and leaves the ion flux unchanged.
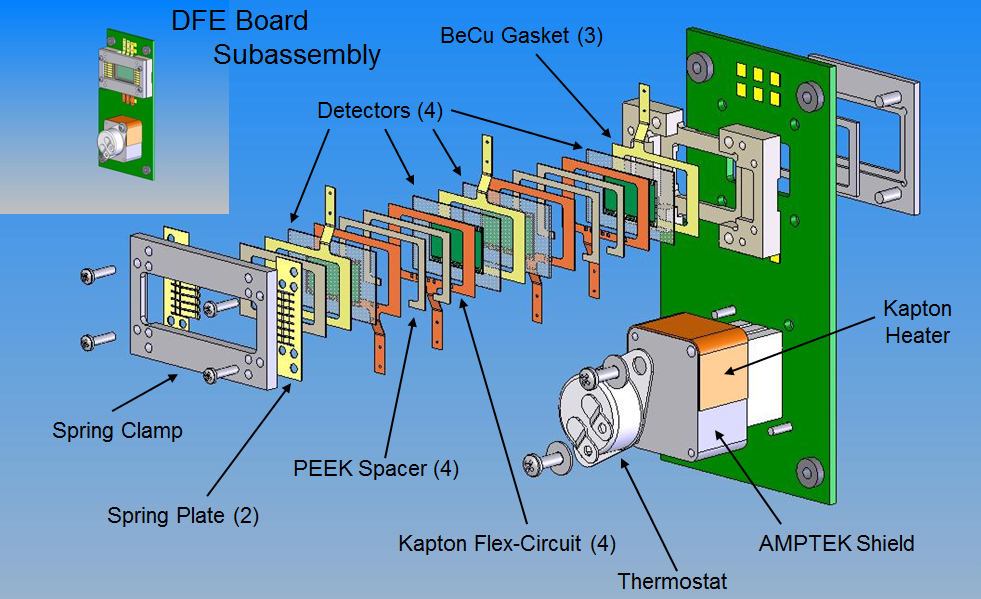
The central detector is a 500-micron ion-implanted silicon foil while the outer detector is a 300-micron Foil Detector on the electron side and a 300-micron Open Detector on the ion side. The foil detectors feature a Kapton-Flex Circuit and Wireband Loop to provide an electrical connection between the Flex-Circuit and the detector. The detector-Flex Circuit assemblies are separated by PEEK spacers. The detector stack also features three Beryllium-Copper Gaskets and spring clamps to attach the stack to the Detector Board.
The Detector Bard is equipped with an electronics assembly that uses an AMPTEK shield, a thermostat and Kapton Heater.
The Al-Polyamide-Al foils are held in place by foil frames while the Sm-Co magnets are held in place by an aluminum magnet cage that is attached to one of two Copper-Iron Yokes that join the two Detector Boards within the instrument.
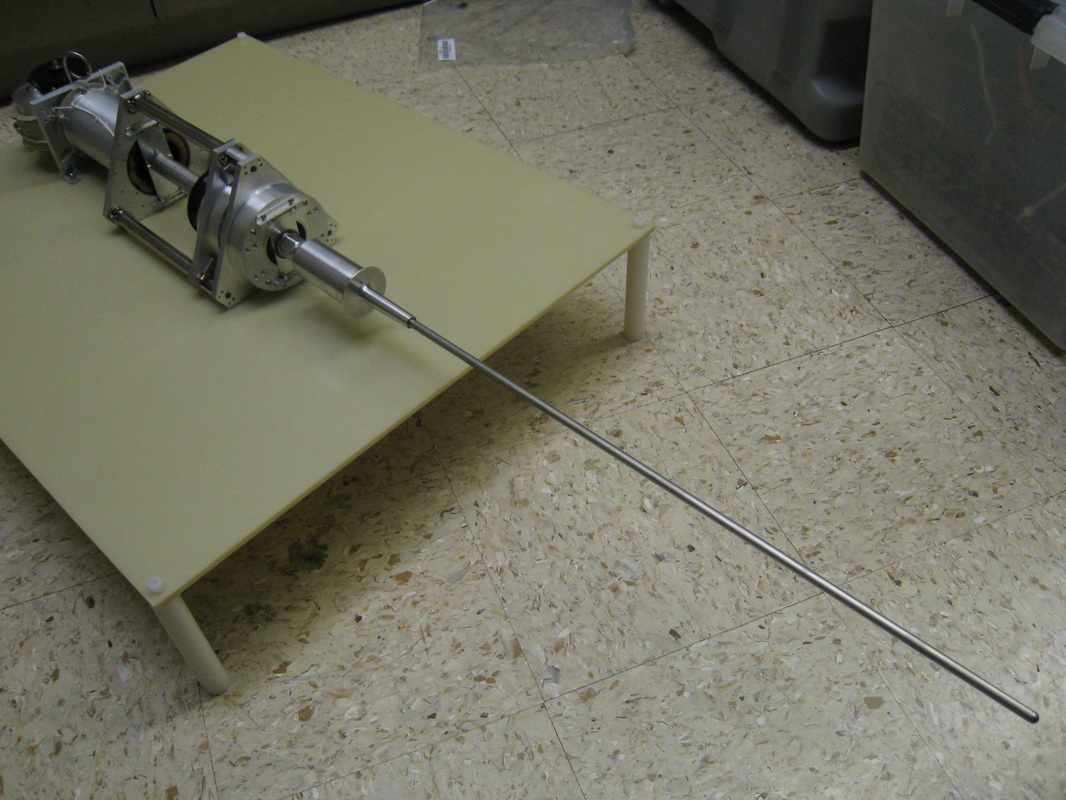
Each SEP unit is installed on the MAVEN spacecraft via a single rigid mounting flange and two mounting flanges with kinematic flexures to allow relative motion during expansion/contraction of the vehicle as a result of temperature gradients.
Each of the two Sensor Units features two 21-pin connectors that provide the data and power interface to the Data Acquisition & Processing board and the Power Control Board. The SEP instrument will operate at three measurement cadences: 32 seconds when MAVEN is far from the planet, 8 seconds between 300 and 800 Kilometers, and 2 seconds below 300 Kilometers.
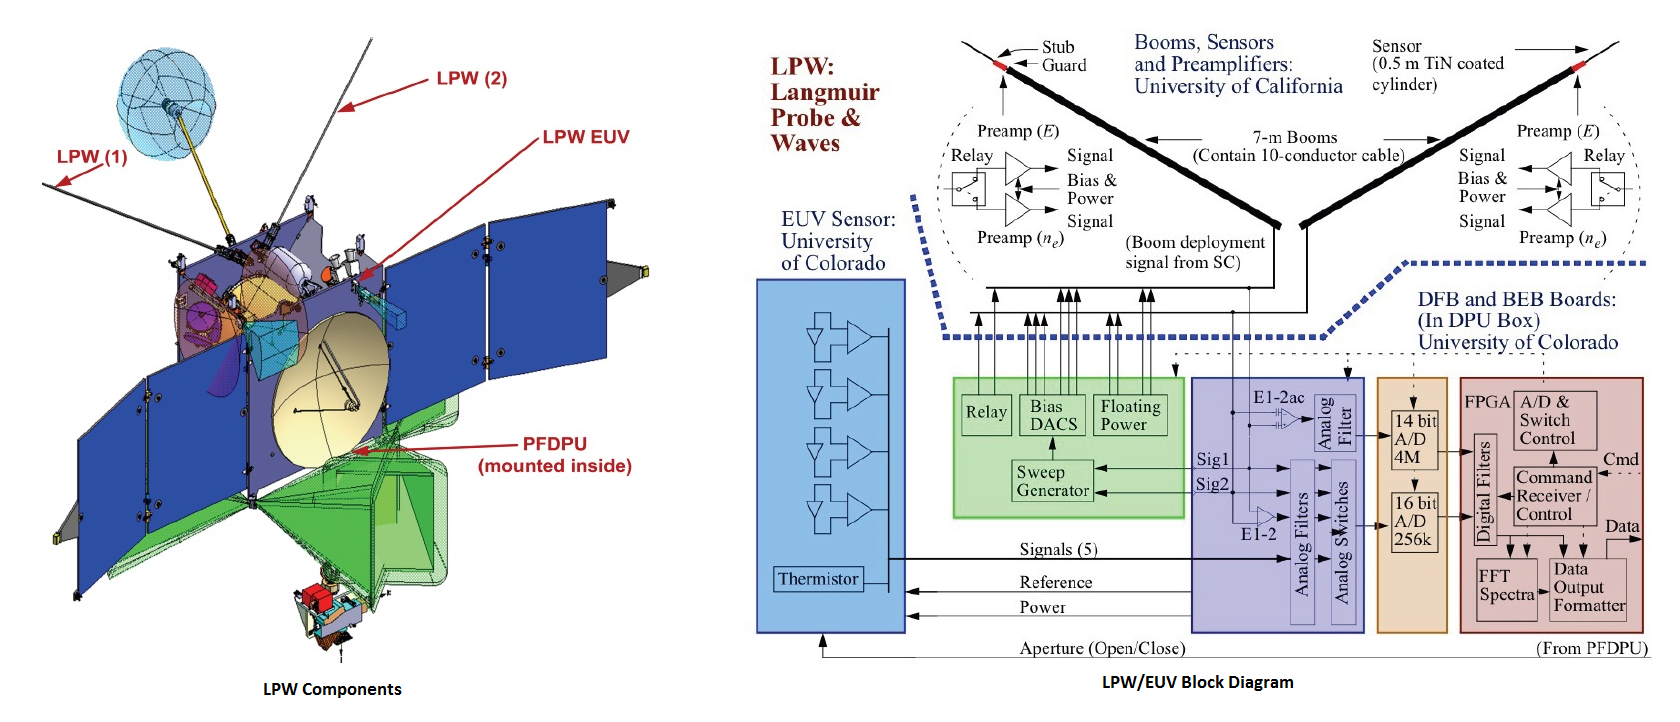
Langmuir Probe and Waves – LPW
The LPW instrument is also part of the Particles and Fields Package. It measures ionospheric properties, wave heating of the upper atmosphere and solar extreme ultraviolet radiation input into the Martian atmosphere. LPW studies electron temperature and number density throughout the upper atmosphere, electric field wave power at low frequencies that are important for ion heating, and wave spectra of naturally emitted and actively simulated Langmuir waves to calibrate density measurements.
Langmuir probes can determine electron temperature, electron densities and the electric potential of a plasma. Two electrodes are inserted into a plasma environment. The electrodes have a constant or time-varying electric potential between them to allow the determination of physical plasma properties by measuring currents and potentials in this two-electrode system.
The LPW instrument features cylindrical sensors that are installed at the tips of two 7-meter long booms which are mounted on the upper deck of the spacecraft. The two sensors have a Titanium nitride coating and are connected to the instrument electronics via a 10-conductor cable spanning the length of the booms.
Each of the booms has its own preamplifier that is also located on the boom to generate plasma density, electron energy and relay signals. The Sensor Electronics provide floating power supply to the sensors as well as voltage bias that is produced by a Sweep Generator. LPW has a sweep range of +/-50 Volts. The sweep voltages are provided by an analog electronics assembly that consists of analog filters and switches.
A 14-bit and a 16-bit Analog to Digital Converter generates a digital signal output from the analog signals for processing. The 16-bit converter processes 64,000 samples per second while the 14-bit converter processes 4 million samples per second.
The LPW instrument controller processes and executes commands to control all instrument functions via a Command Receiver and A/D & Switch Control Module. Digital data is processed using Fast Fourier Transform algorithms to create spectra that are processed by a Data Output Formatter and transmitted to the Particles & Fields Data Processing Unit for storage and downlink.
Performing science data acquisition around periapsis, LPW performs four-second sequences that begin with a one-second probe sweep followed by a second of passive medium & high frequency electric field data acquisitions and another second dedicated to the second sweep.
Then, the White Noise Generator sends out a signal of 50 kHz to 2 MHz for 1/64 to 1 second to excite Langmuir waves in the nearby plasma. After a short delay, the LPW instrument measures the plasma resonances excited by the white noise to determine the plasma frequency and plasma density with high accuracy. After the short active sounding interval, another passive electric field measurement takes place. After four seconds, the cycle is repeated.
LPW measures low-frequency electric fields from 0.05 Hz to 10 Hz and high-frequency fields of 90 kHz to 1.6 MHz. Field measurements have a resolution of 0.3 mV/m while current measurements have a resolution of 3.1nA. Current measurements are completed every two seconds as the sensor is stepped through 128 pre-determined voltages. Through data analysis, photoelectron currents are subtracted after being determined in low-density conditions at some point in the orbit. Electron energy, density and spacecraft potential are determined by LPW.
Below 500 Kilometers, LPW determines electron energy and electric field density every two seconds, using one probe to perform Langmuir voltage sweeps while the other probe measures payload potential. Electric field waveforms are generated by collecting 64 data points for one second, every other second. Electric field wave spectra are obtained every 4 seconds covering 10 Hz to 2 MHz. Active sounding wave spectra covering 50 kHz to 2 MHz are taken every four seconds.
Between 500 and 1,000 Kilometers, I-V sweeps are performed every 8 seconds, electric field waveforms are generated using 64 points every four seconds every 4-second period, electric field wave spectra and active sounding spectra are acquired every 16 seconds.
Above 1,000 Kilometers, I-V sweeps occur every 64 seconds, electric field waveforms are generated with 64 points acquired over 32 seconds, every other 32-second period, and electric field wave spectra and active sounding spectra every 128 seconds.
Extreme-Ultraviolet Instrument – EUV
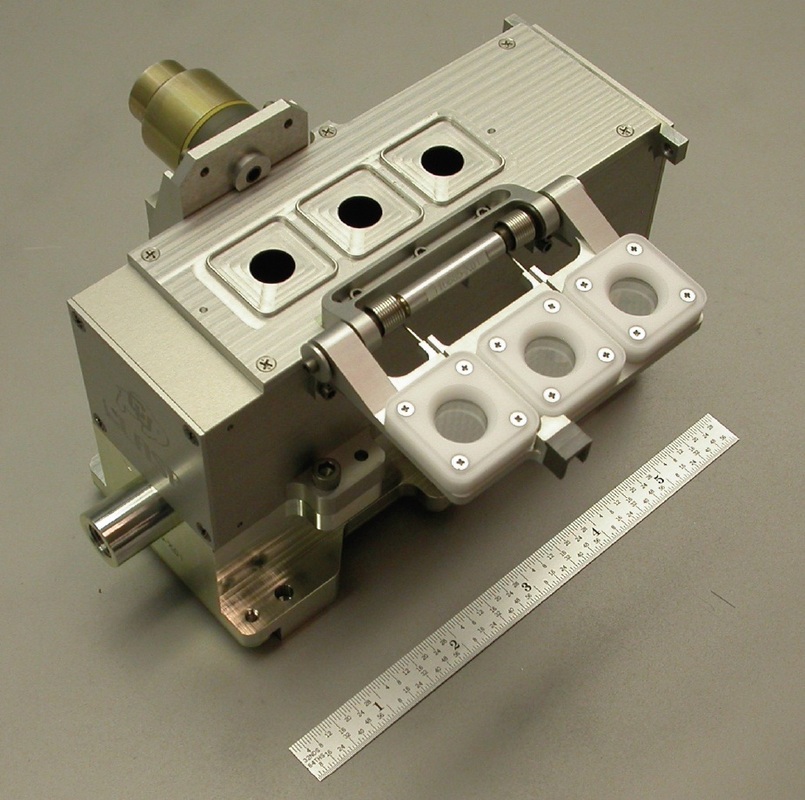
The second component of the LPW instrument is the Extreme-Ultraviolet instrument that consists of an assembly featuring four photodiodes and a thermistor, installed on the instrument deck of the MAVEN spacecraft.
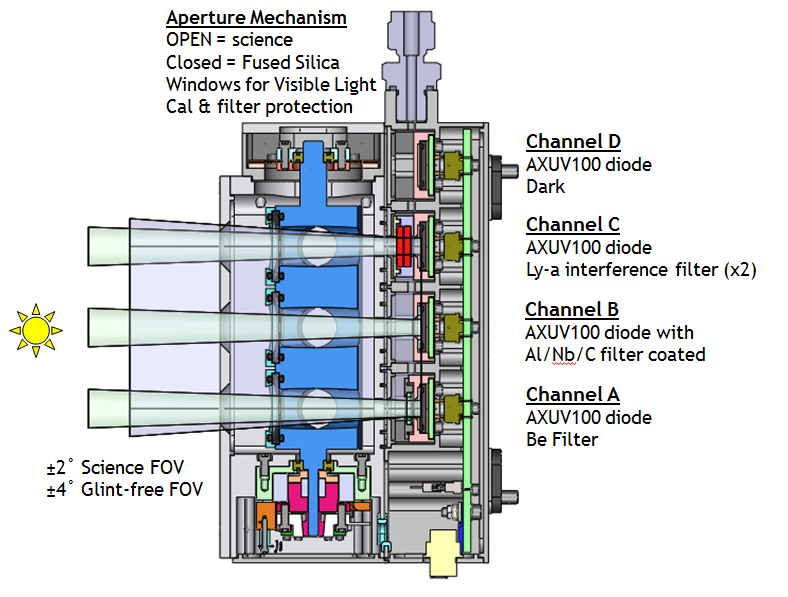
The system consists of three AXUV100 photodiodes used for science measurements – one Be filtered photodiode operating at 0.1 to 7 nanometers, one Al/Nb/C coated photodiode covering 17 to 22 nm, and one Lyman-Alpha photodiode operating at 121 to 122 nm for Hydrogen/Deuterium measurements. The fourth AXUV100 diode is hidden within the diode module to provide dark measurements. All photodiodes have a 2-degree field of view to allow for pointing and alignment errors.
The instrument is protected by a door that is deployed once in Mars orbit to prevent any contamination on the delicate photodiodes, especially the Lyman-Alpha channel. The aperture is also closed during deep dips into the atmosphere or when spacecraft pointing precludes EUV measurements.
The three science diodes are equipped with fused silica windows that can be opened for visible light calibrations and filter protection. The system uses AD549 pre-amplifiers.
The analog signals from the EUV suite will be processed within the LPW electronics. Signal currents will be sampled at a high cadence of 1kHz, filtered and averaged to 1-second cadence.
The three photodiodes do not cover the entire EUV spectrum, however, they cover the most dynamic range of the spectrum, allowing gaps to be modeled from data acquired through the Flare Irradiance Spectral Model based on NASA SDO Data in order to reproduce the full 0.1 to 190-nanometer spectrum.
Magnetometer
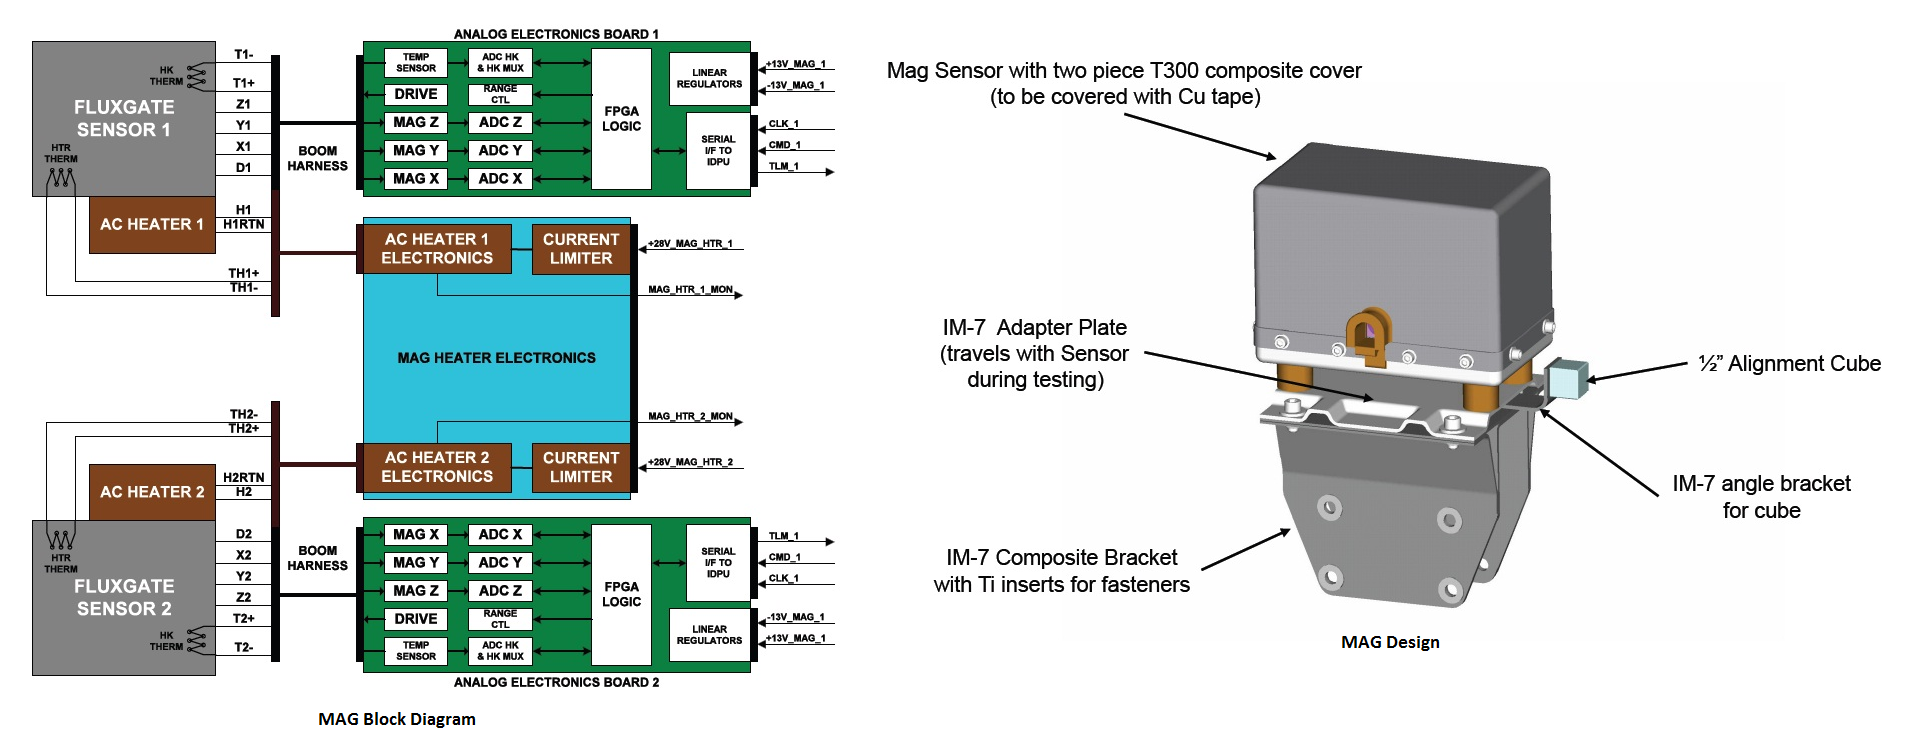
MAVEN’s Magnetometers are installed on boards that are attached to the outer solar panels. The instrument measures the vector magnetic field of Mars, examines the interaction of solar winds with Mars and supports other measurements made by the Particles & Fields Package. The Magnetometer also looks at crustal magnetic fields that produce mini-magnetospheres that influence the interaction of the Martian atmosphere with the solar wind.
The instrument features two wide-range, high performance ring core fluxgate magnetometers. The two fluxgate sensors use the nonlinearity of magnetization properties for the high permeability of easily saturated ferromagnetic alloys to serve as an indicator for the local field strength.
The system operates at three dynamic ranges of +/-65,536 nano tesla, +/- 2,048nT and +/- 512 nT with a 0.015nT resolution. Each sensor takes 32 vector samples per second.
The two sensors have separate electrical and data systems to provide redundancy to the instrument. Each fluxgate sensor is equipped with one AC heater that is actuated based on thermostat data that is processed by the MAG Heater Electronics which also provide power to the heaters.
Two separate electronics boards receive the analog magnetometer signals and process the three components of the vector field into a single data product that is sent to the MAVEN data system for downlink. The analog electronics boards also provide the instrument telemetry stream and execute all instrument commands.
The MAG sensors are protected by a T300 composite cover and are attached to an adapter plate that interfaces with an IM-7 composite bracket with Titanium inserts for fasteners to attach the unit to its diving board.
Accelerometer Science
Although MAVEN’s Inertial Measurement Unit is not part of the science payload, it can still be used to acquire scientific data. The IMU constantly measures spacecraft orientation and accelerations acting on the vehicle. This data can be used to generate vertical profiles of atmospheric density and temperature as well as possible wind profiles. Atmospheric density data is derived from acceleration data while temperature data is determined hydrostatically. Winds are derived from navigation and attitude rate data.
